Fig. 6.
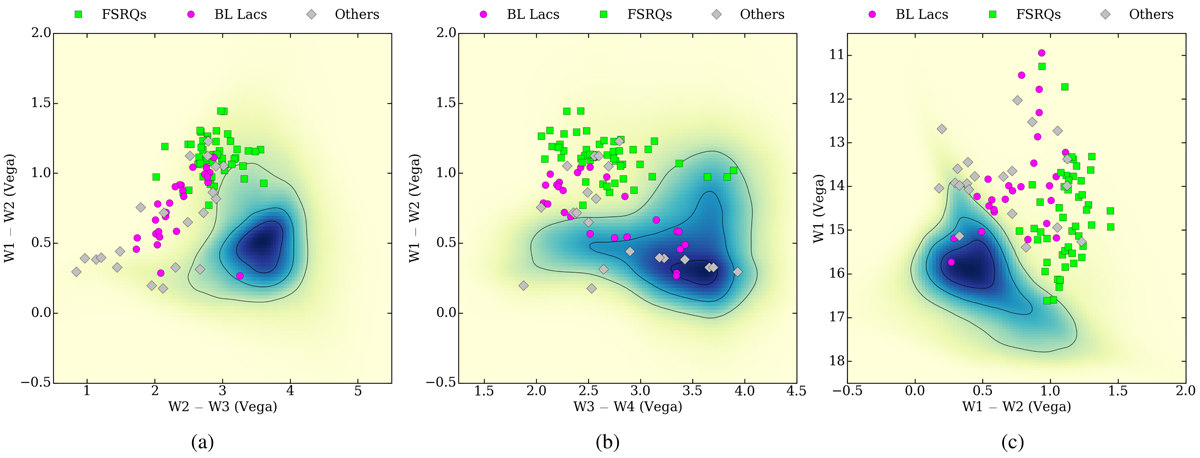
Two-dimensional histograms show the W1 − W2 vs. W2 − W3 (panel a) and the W1 − W2 vs. W3 − W4 (panel b) colour-colour diagrams, and the W1 − W2 vs. W1 − W2 (panel c) colour-magnitude diagram. The IR colours for the entire LDR1 sample for which there is WISE data available (218 595 of 318 520 sources) is the two-dimensional histogram, with contours indicating the 25%, 50%, and 75% levels. The points are the LDR1 sources from our sample for which there is WISE data (96 of 98 sources).
Current usage metrics show cumulative count of Article Views (full-text article views including HTML views, PDF and ePub downloads, according to the available data) and Abstracts Views on Vision4Press platform.
Data correspond to usage on the plateform after 2015. The current usage metrics is available 48-96 hours after online publication and is updated daily on week days.
Initial download of the metrics may take a while.