Fig. 9.
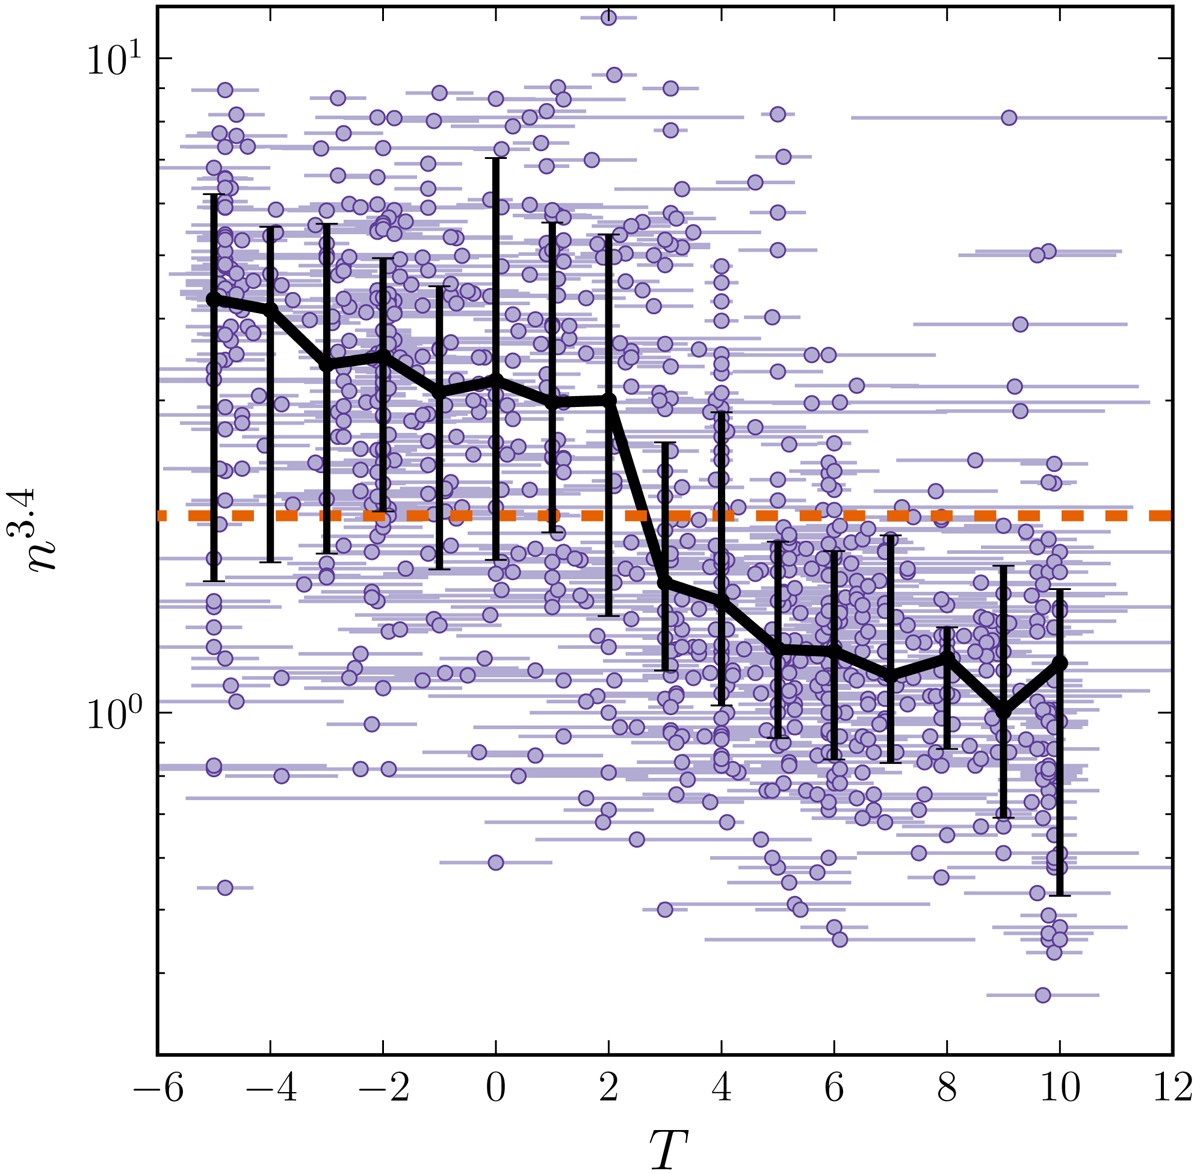
Relationship between the Sérsic index in the WISE W1 band and the Hubble stage for the sample of 865 DustPedia galaxies. The median average and the 15 and 85 percentiles are shown by the black colour for each bin of 1 T. The orange dashed line refers to n3.4 = 2, the border value to split galaxies into bulgeless (n3.4 < 2) and bulge-dominated galaxies (n3.4 > 2).
Current usage metrics show cumulative count of Article Views (full-text article views including HTML views, PDF and ePub downloads, according to the available data) and Abstracts Views on Vision4Press platform.
Data correspond to usage on the plateform after 2015. The current usage metrics is available 48-96 hours after online publication and is updated daily on week days.
Initial download of the metrics may take a while.