Fig. 7.
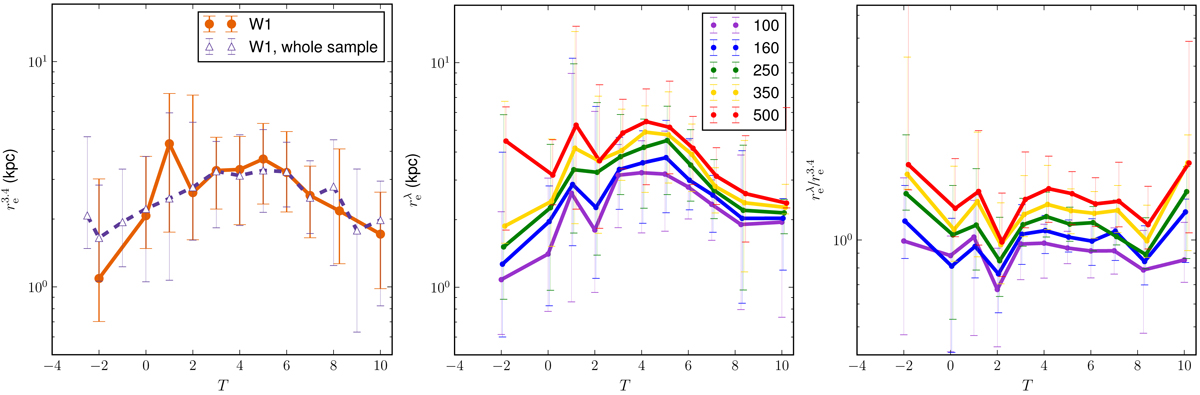
Dependence of the effective radius measured in the WISE W1 band on the Hubble stage (left panel), the dependences of the effective radius measured in the five Herschel bands on the Hubble stage (middle panel), and the dependences of the ratio of the effective radius in each Herschel band to the effective radius in the WISE W1 band on the Hubble stage (right panel). Each dependence is plotted for the averaged data for the subsample of 320 galaxies (except for the lilac line in the left plot which refers to the sample of 865 DustPedia galaxies) within a bin of 1 T, with 15 and 85 percentiles shown. All lenticular galaxies (T ≤ 0) are combined together and shown by T = −2. Sm and Sdm galaxies are joined together in one type T = 8.
Current usage metrics show cumulative count of Article Views (full-text article views including HTML views, PDF and ePub downloads, according to the available data) and Abstracts Views on Vision4Press platform.
Data correspond to usage on the plateform after 2015. The current usage metrics is available 48-96 hours after online publication and is updated daily on week days.
Initial download of the metrics may take a while.