Fig. 4.
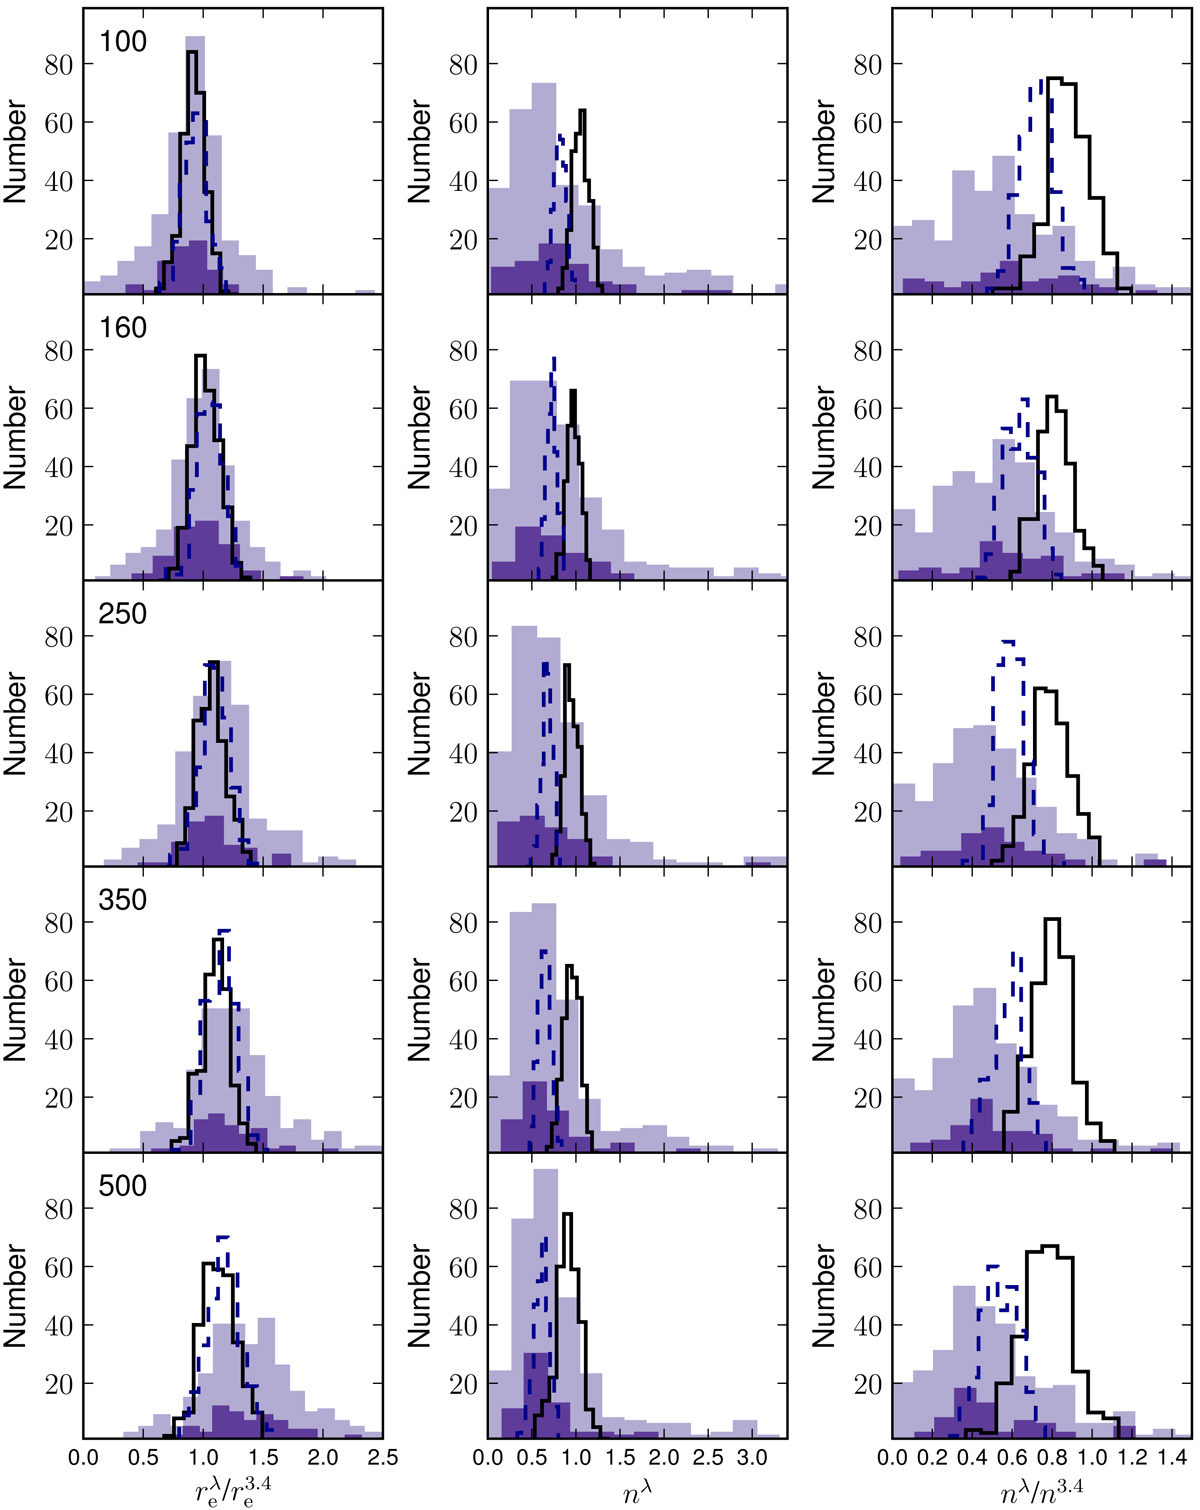
Distributions of different parameters over wavelength. Left panel: ratio of the effective radius in each Herschel band to the effective radius in the WISE W1 band; middle panel: distribution of the Sérsic index in each Herschel band; right panel: ratio of the Sérsic index in each Herschel band to the Sérsic index in the WISE W1 band. By the lilac colour we show the subsample of 320 galaxies with reliable fitting results, whereas the dark lilac corresponds to the reference sample of 71 galaxies. The black solid and dark blue dashed lines refer to the simulations from Appendix B with an exponential and Sérsic disc, respectively.
Current usage metrics show cumulative count of Article Views (full-text article views including HTML views, PDF and ePub downloads, according to the available data) and Abstracts Views on Vision4Press platform.
Data correspond to usage on the plateform after 2015. The current usage metrics is available 48-96 hours after online publication and is updated daily on week days.
Initial download of the metrics may take a while.