Fig. C.2.
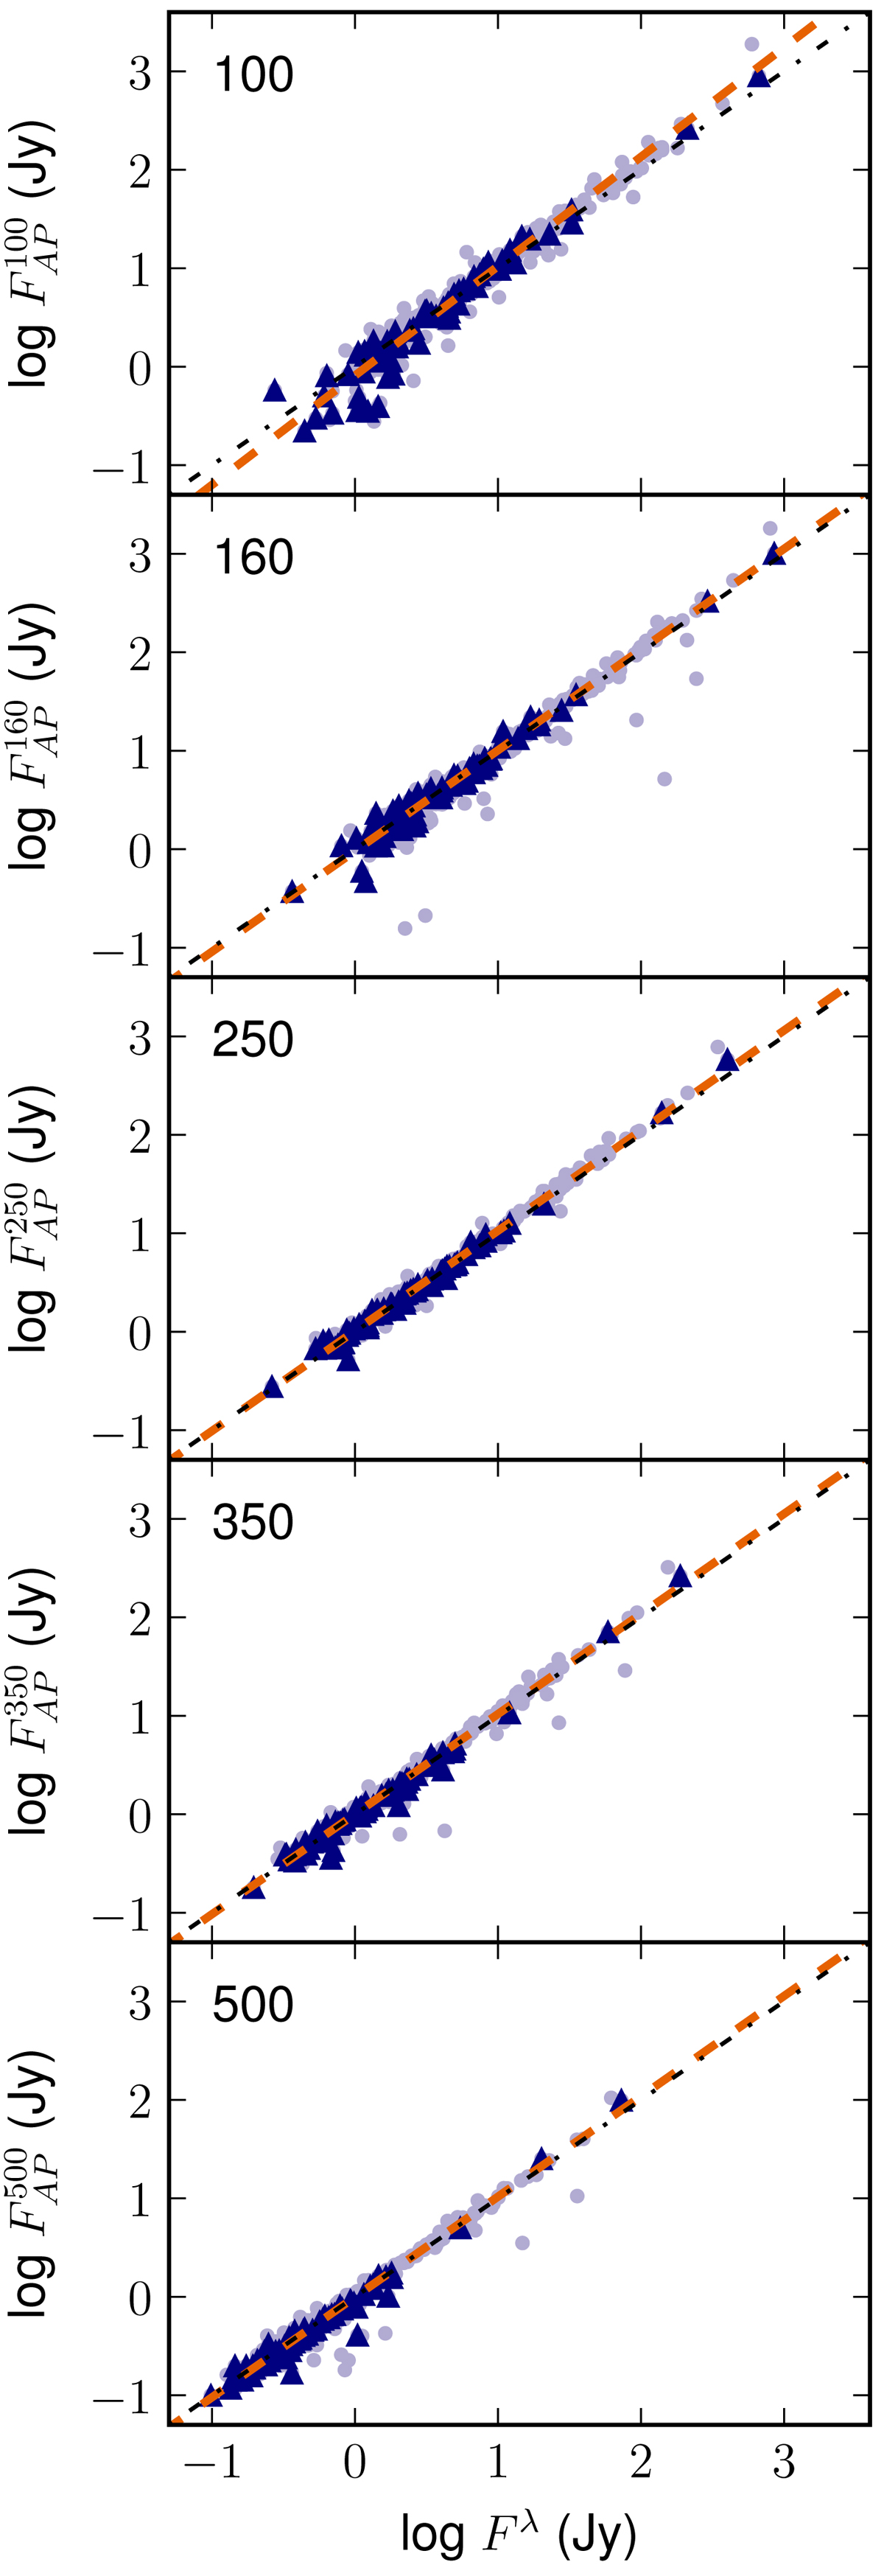
Comparison between the single Sérsic model (x-axis) and the aperture (y-axis) taken from C18. The lilac filled circles refer to all galaxies with reliable models, while the dark-blue filled triangles correspond to the reference sample. The black dotdash line shows the one-to-one relationship and the orange dashed line depicts the fit for all galaxies shown.
Current usage metrics show cumulative count of Article Views (full-text article views including HTML views, PDF and ePub downloads, according to the available data) and Abstracts Views on Vision4Press platform.
Data correspond to usage on the plateform after 2015. The current usage metrics is available 48-96 hours after online publication and is updated daily on week days.
Initial download of the metrics may take a while.