Fig. C.1.
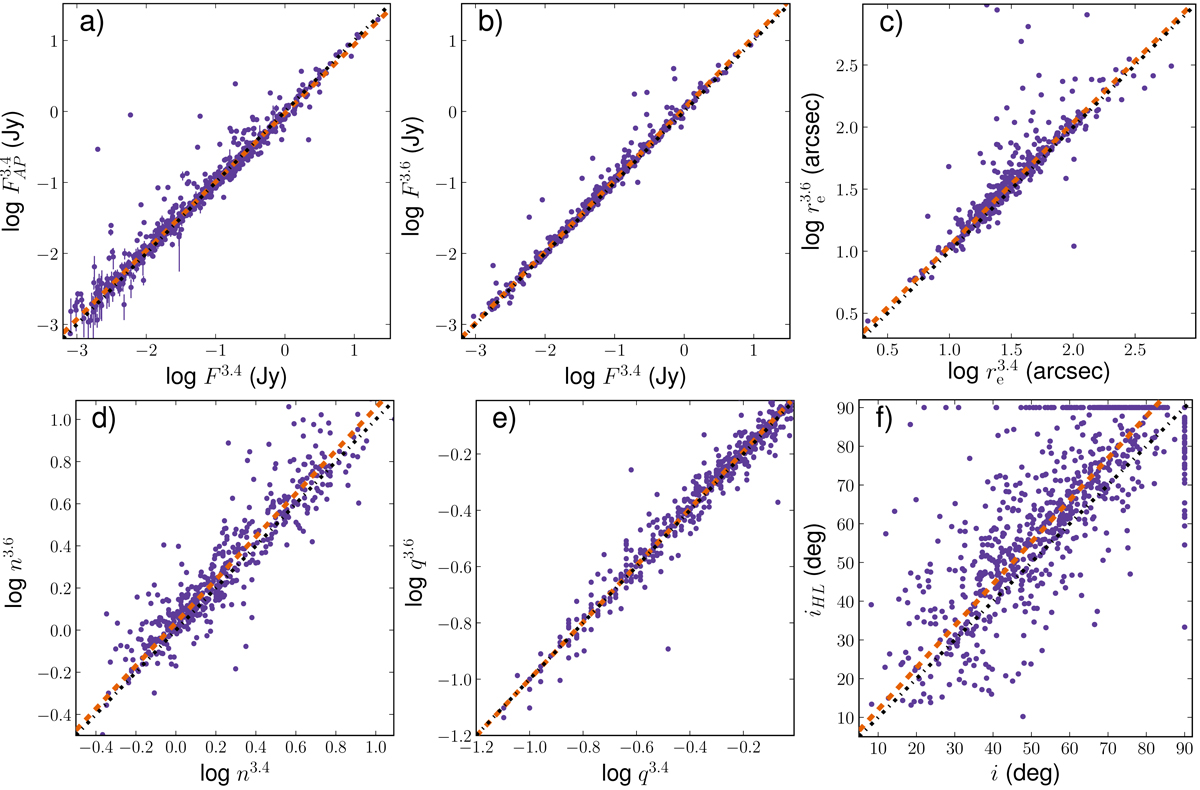
Comparison between our results (x-axis) and the same parameter from the literature (y-axis): between the single Sérsic model and aperture flux from C18 (panel a), between the model flux in WISE W1 and the one from the S4G single Sérsic modelling (panel b), between the effective radius in WISE W1 and the one from the S4G single Sérsic modelling (panel c), between the Sérsic index in WISE W1 and the one from the S4G single Sérsic modelling (panel d), between the model flattening in WISE W1 and the one from the S4G single Sérsic fitting (panel e), between our estimate of the galaxy inclination and the one taken from HyperLeda (panel f). The clustering dots at 90° for both estimates are either galaxies for which an edge-on model in the S4G modelling pipeline was adopted, or for which the apparent flattening was less then the intrinsic one (see Appendix D). The black dotdash lines show the one-to-one relationship and the orange dashed lines refer to the regression lines.
Current usage metrics show cumulative count of Article Views (full-text article views including HTML views, PDF and ePub downloads, according to the available data) and Abstracts Views on Vision4Press platform.
Data correspond to usage on the plateform after 2015. The current usage metrics is available 48-96 hours after online publication and is updated daily on week days.
Initial download of the metrics may take a while.