Fig. 14.
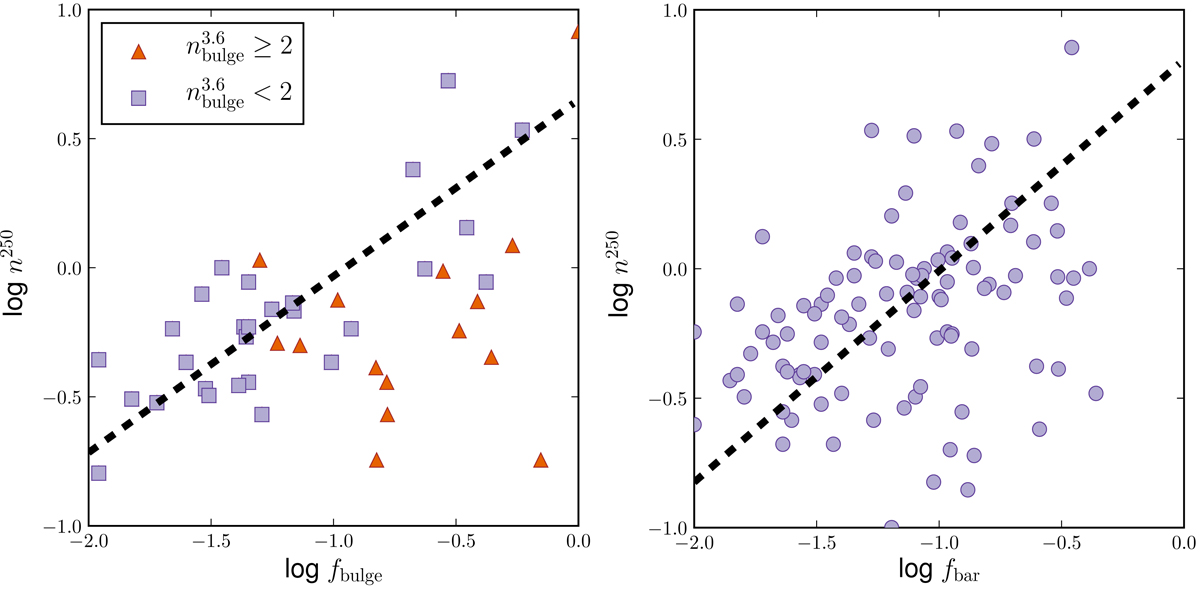
Correlations between the bulge (left plot) and bar (right plot) fraction to the total galaxy model, based on the S4G decomposition, and the Sérsic index in the SPIRE 250 μm band. The black dashed lines in each plot represent the regression lines: log n250 = 0.68 fbulge + 0.65 (ρ = 0.78) and log n250 = 0.82 fbar + 0.81 (ρ = 0.60).
Current usage metrics show cumulative count of Article Views (full-text article views including HTML views, PDF and ePub downloads, according to the available data) and Abstracts Views on Vision4Press platform.
Data correspond to usage on the plateform after 2015. The current usage metrics is available 48-96 hours after online publication and is updated daily on week days.
Initial download of the metrics may take a while.