Fig. 11.
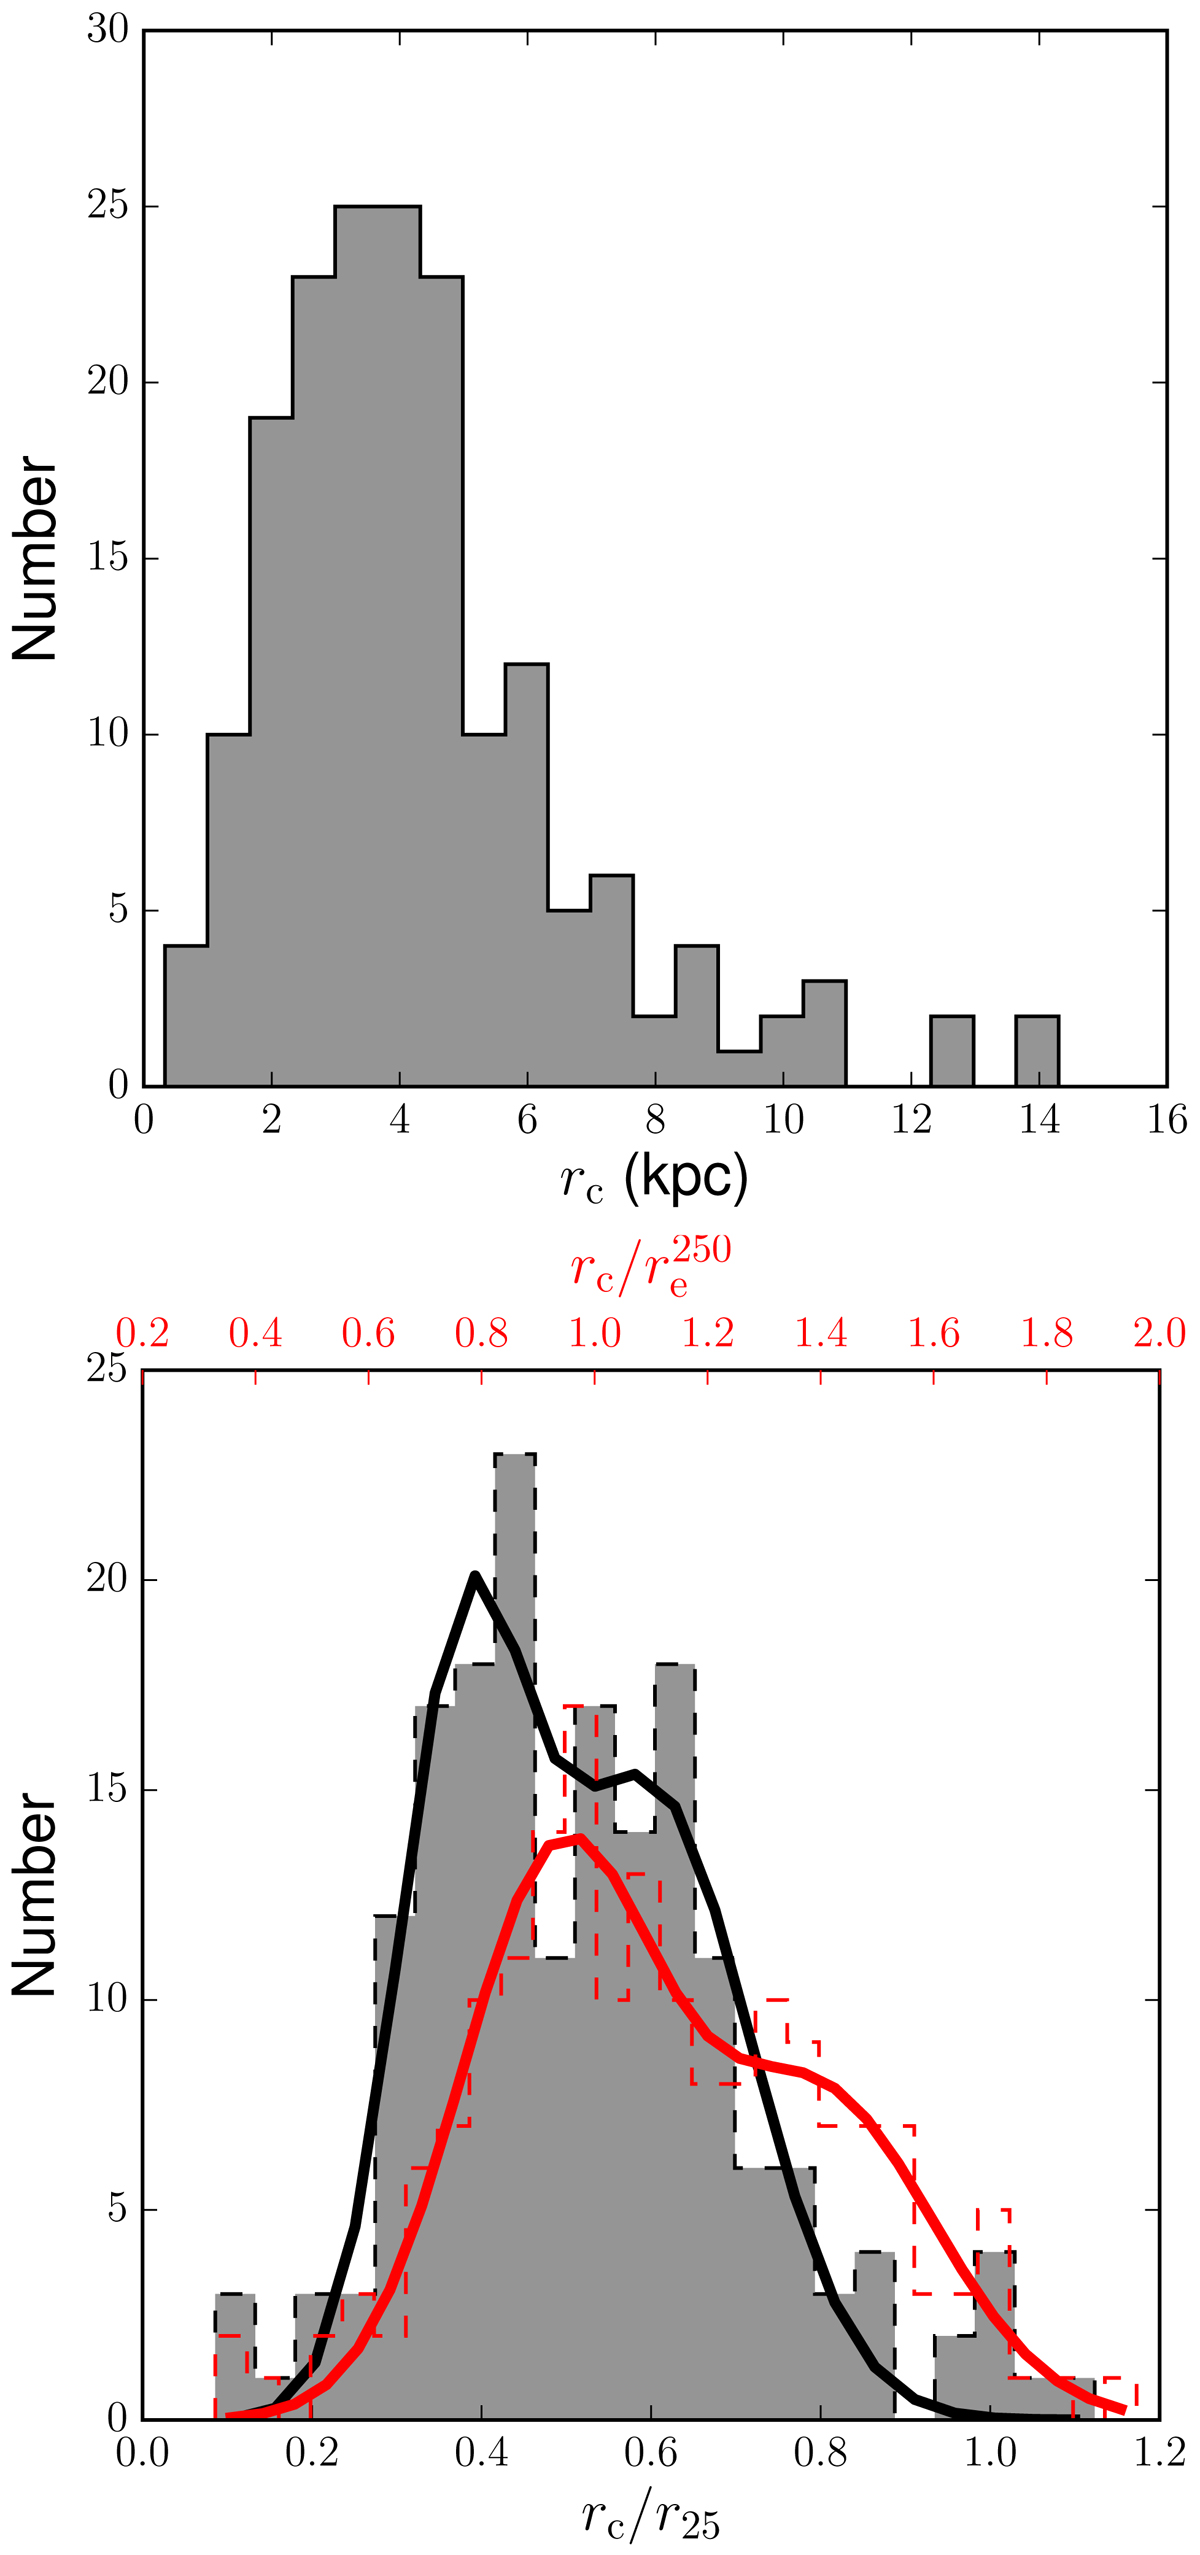
Distributions by the characteristic radius expressed in kpc (top panel), and in units r25 (grey colour) and ![]() (red colour; bottom panel). In the bottom panel we also show two bimodal distributions (as a sum of two Gaussians) fitted to the respecting histograms: for the rc/r25 (black thick solid line) and
(red colour; bottom panel). In the bottom panel we also show two bimodal distributions (as a sum of two Gaussians) fitted to the respecting histograms: for the rc/r25 (black thick solid line) and ![]() (red thick solid line).
(red thick solid line).
Current usage metrics show cumulative count of Article Views (full-text article views including HTML views, PDF and ePub downloads, according to the available data) and Abstracts Views on Vision4Press platform.
Data correspond to usage on the plateform after 2015. The current usage metrics is available 48-96 hours after online publication and is updated daily on week days.
Initial download of the metrics may take a while.