Fig. 10.
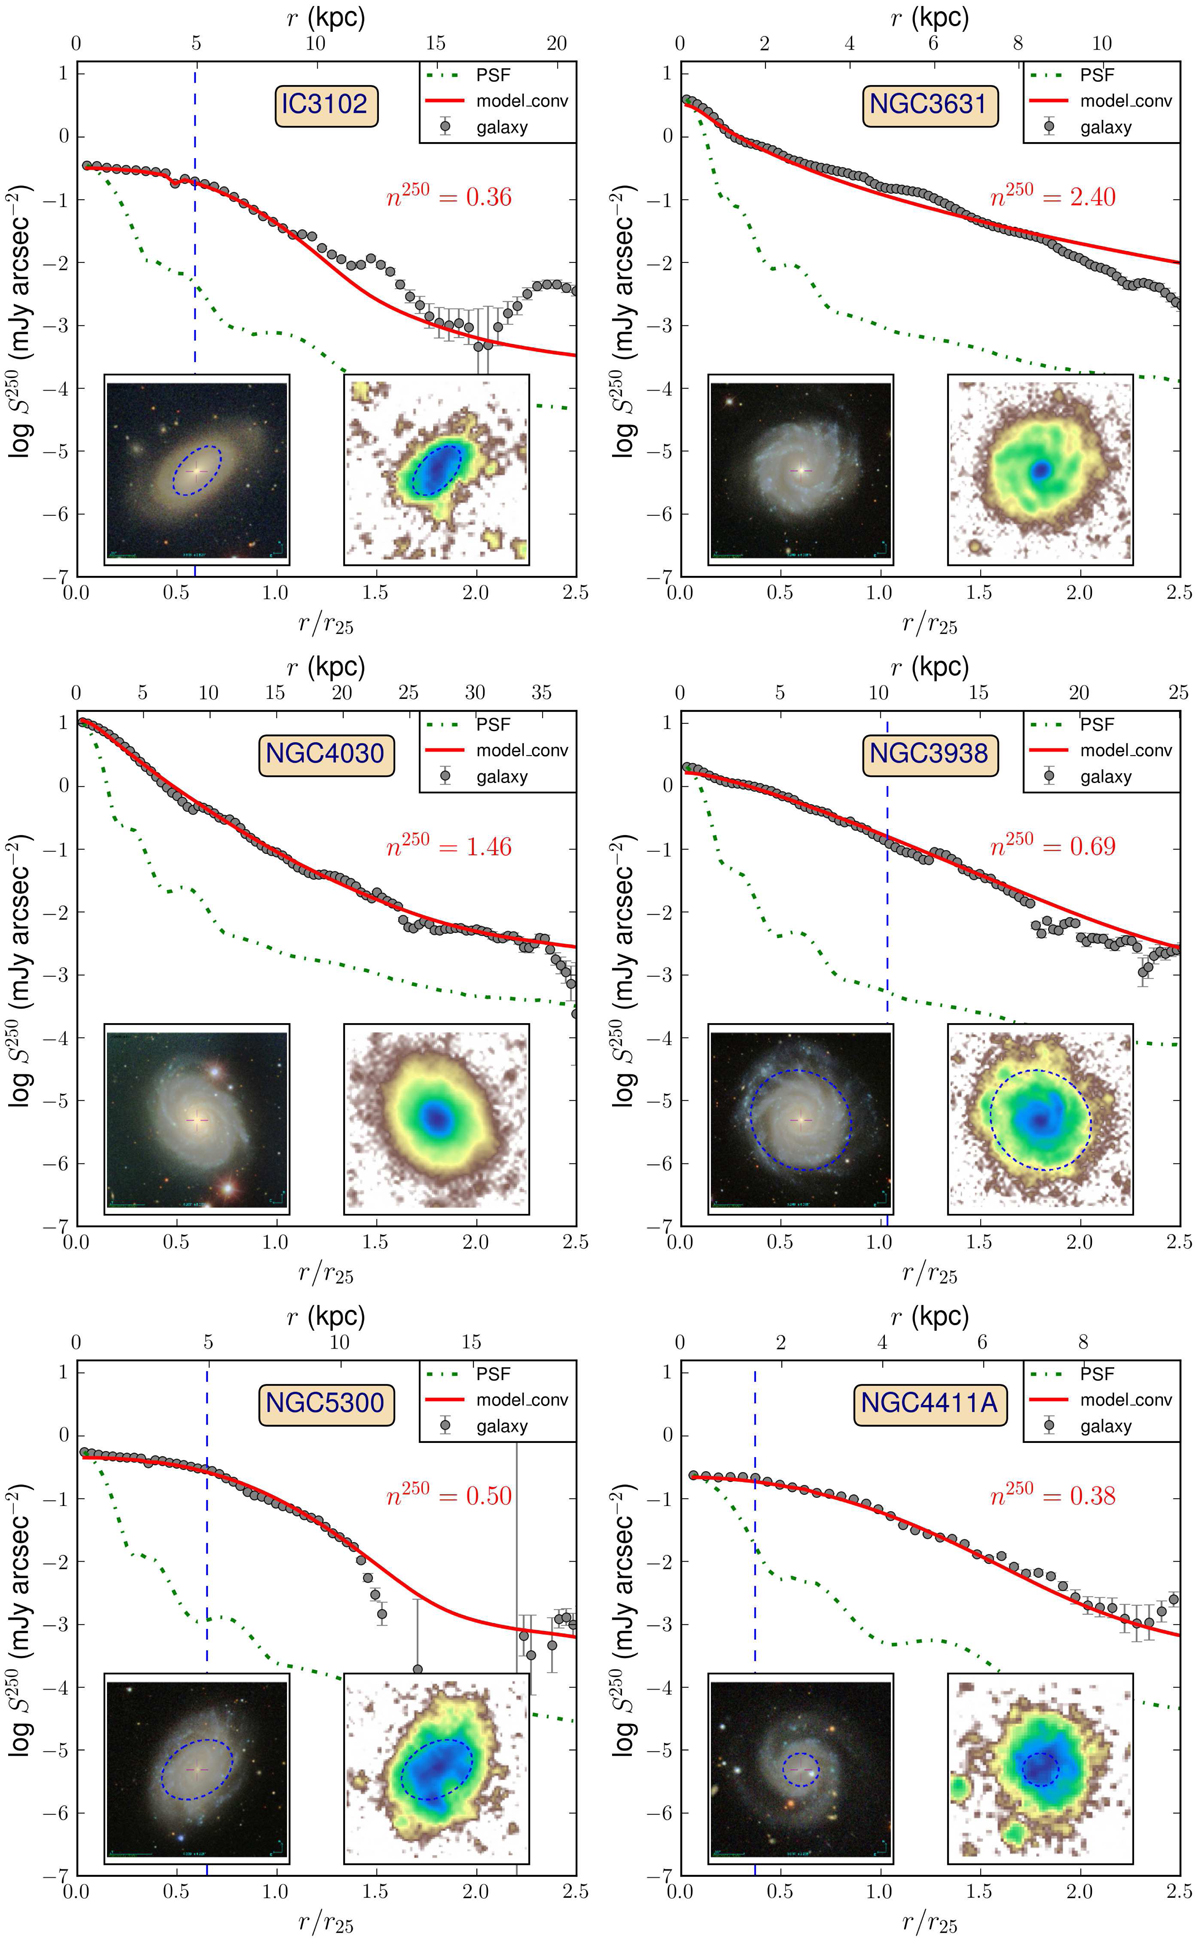
Some typical galaxies in our sample with different features in their SB profiles (no correction for the galaxy inclination has been done). The grey circles represent the azimuthally averaged galaxy profile in the SPIRE 250 μm band. The model (convolved with the respecting PSF which is shown by the green dotdash line) is represented by the red solid line. The blue dashed line shows a break (if applicable) in the profile at some characteristic radius rc (see text). The two images in each plot are a coloured SDSS snapshot (left created with the Aladin sky atlas, http://aladin.u-strasbg.fr/, Bonnarel et al. 2000; Boch & Fernique 2014) and a SPIRE 250 μm band image (right). Both images have the same scale and orientation.
Current usage metrics show cumulative count of Article Views (full-text article views including HTML views, PDF and ePub downloads, according to the available data) and Abstracts Views on Vision4Press platform.
Data correspond to usage on the plateform after 2015. The current usage metrics is available 48-96 hours after online publication and is updated daily on week days.
Initial download of the metrics may take a while.