Fig. 8.
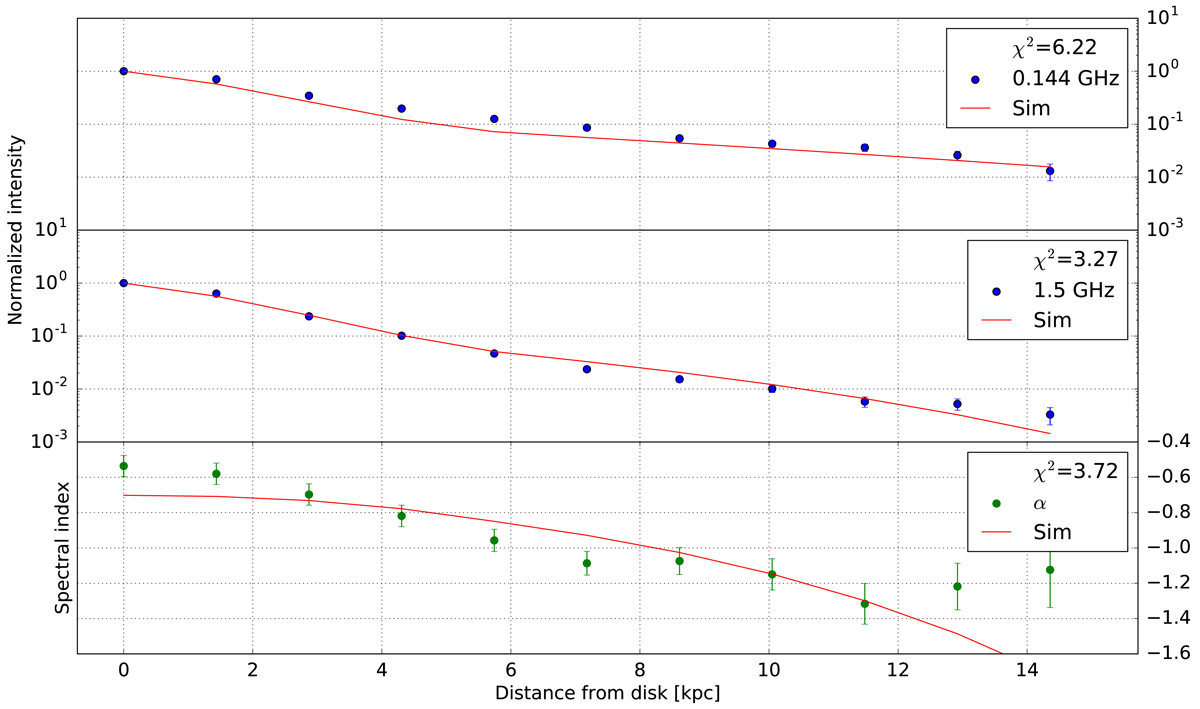
Resulting profiles of the diffusive cosmic-ray propagation simulation. Blue dots represent normalised measured intensities; top panel: LOFAR 144 MHz measurements and middle panel: VLA 1.5 GHz measurements. Bottom panel: radio spectral index profile. In all panels, the red lines represent the simulated quantity. The scale for the intensity profiles is logarithmic, whereas the spectral index is shown in linear scale.
Current usage metrics show cumulative count of Article Views (full-text article views including HTML views, PDF and ePub downloads, according to the available data) and Abstracts Views on Vision4Press platform.
Data correspond to usage on the plateform after 2015. The current usage metrics is available 48-96 hours after online publication and is updated daily on week days.
Initial download of the metrics may take a while.