Fig. 4.
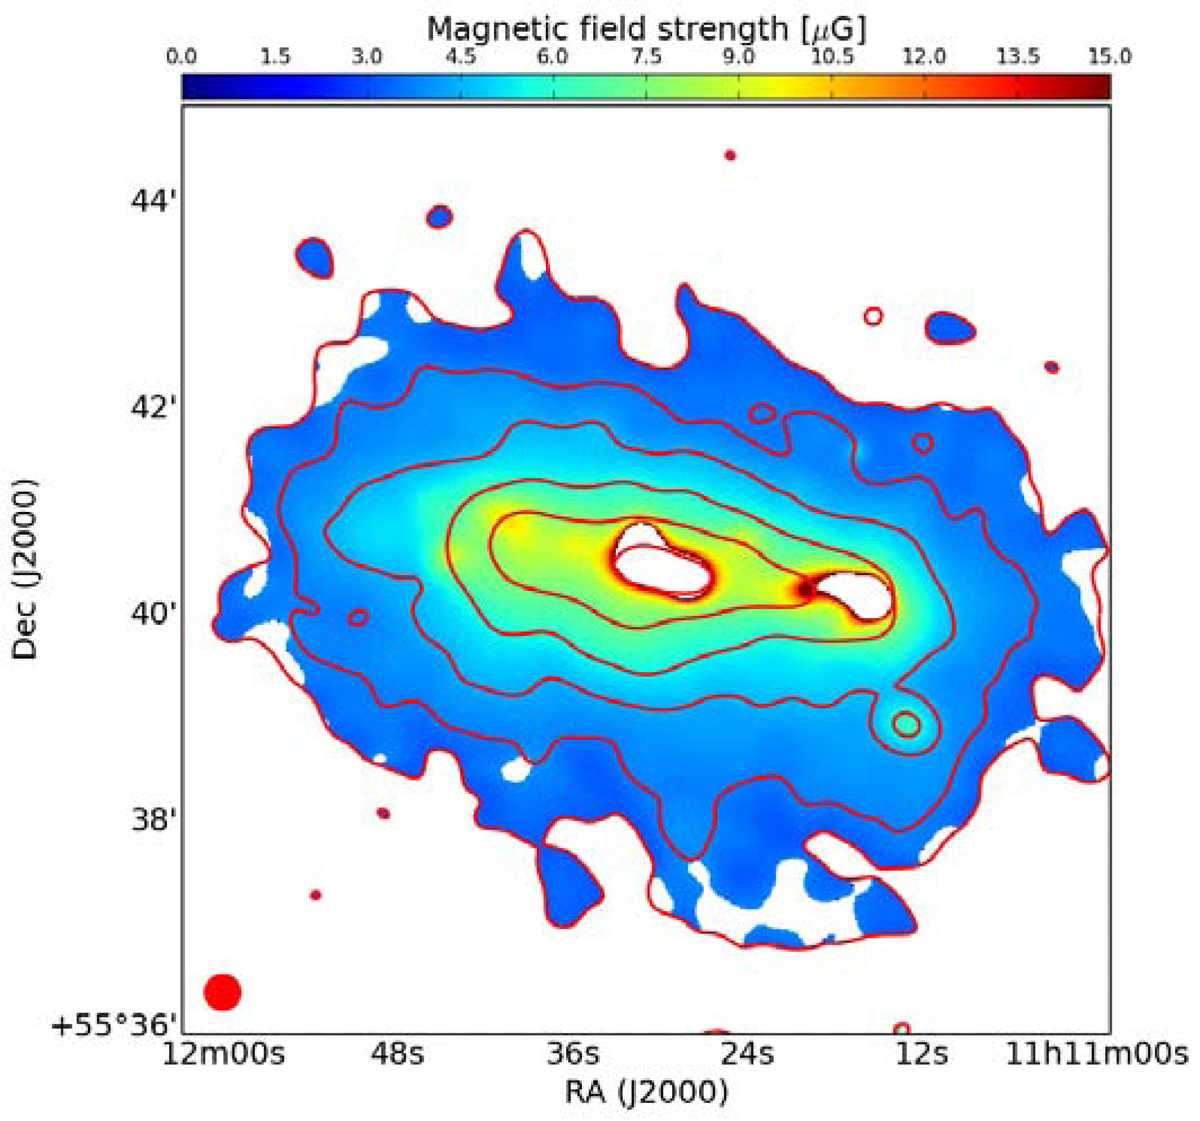
Magnetic field strength map derived through the equipartition assumption using the spectral index between L band and 144 MHz and synchrotron flux density at 144 MHz. Red contours show the surface brightness distribution of the 144 MHz map as shown in Fig. 1. The central region and a region to the west (both in white) were blanked because the spectral index α is higher than −0.5.
Current usage metrics show cumulative count of Article Views (full-text article views including HTML views, PDF and ePub downloads, according to the available data) and Abstracts Views on Vision4Press platform.
Data correspond to usage on the plateform after 2015. The current usage metrics is available 48-96 hours after online publication and is updated daily on week days.
Initial download of the metrics may take a while.