Fig. 11.
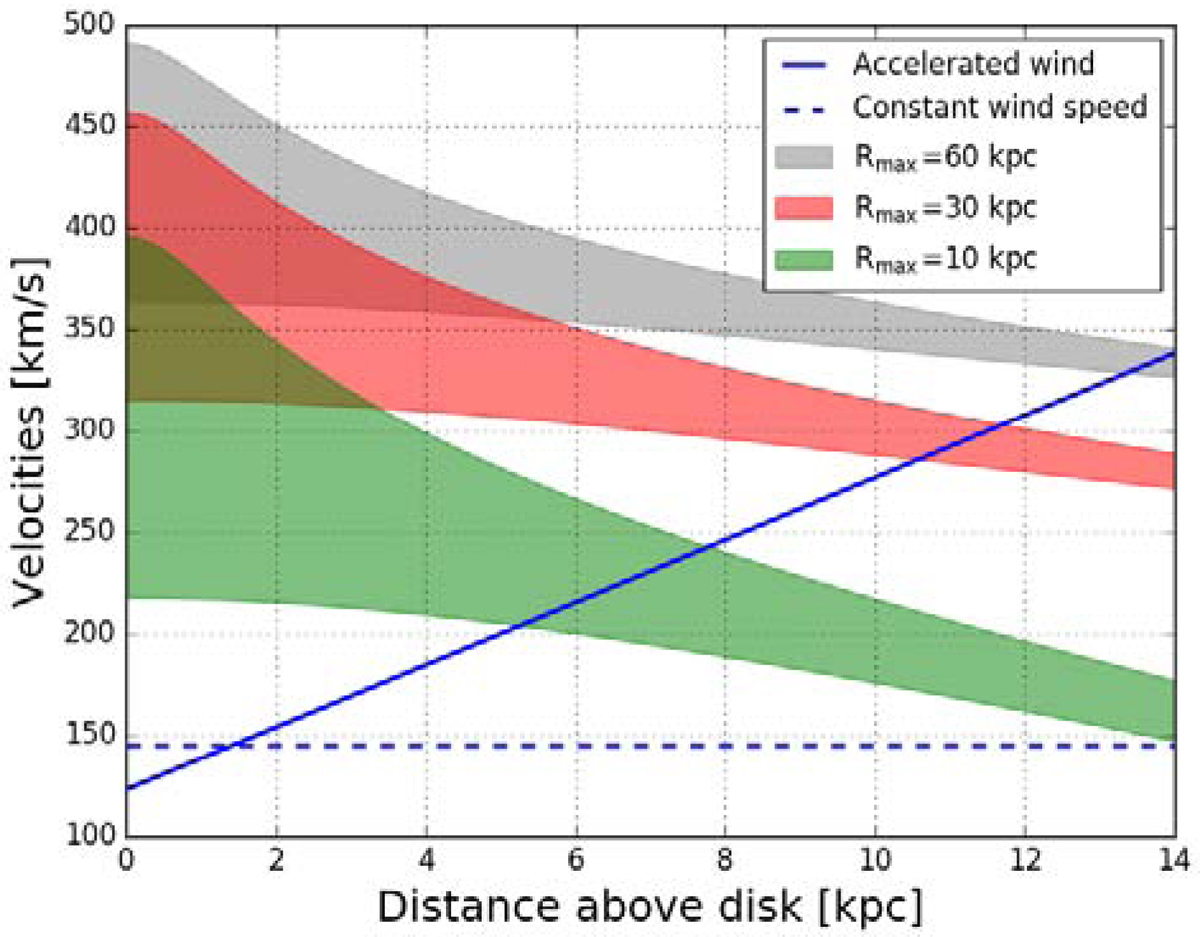
Wind speed profile of the different wind models derived from the simulations shown in Figs. 9 and 10 (blue lines; constant or linearly increasing speed) and ranges of calculated escape velocities for this galaxy. The coloured areas show the escape velocities calculated for different values of the outer radius of the galaxy (Rmax = 60 kpc in grey; Rmax = 30 kpc in red; and Rmax = 10 kpc in green). In each coloured area plot, the radial distance R from the centre of the galaxy in the galactic plane (R = (r2 − z2)1/2, where r is the radius in spherical coordinates and z is the distance above the disc) increases from 1 kpc (top) to 10 kpc (bottom).
Current usage metrics show cumulative count of Article Views (full-text article views including HTML views, PDF and ePub downloads, according to the available data) and Abstracts Views on Vision4Press platform.
Data correspond to usage on the plateform after 2015. The current usage metrics is available 48-96 hours after online publication and is updated daily on week days.
Initial download of the metrics may take a while.