Fig. 7.
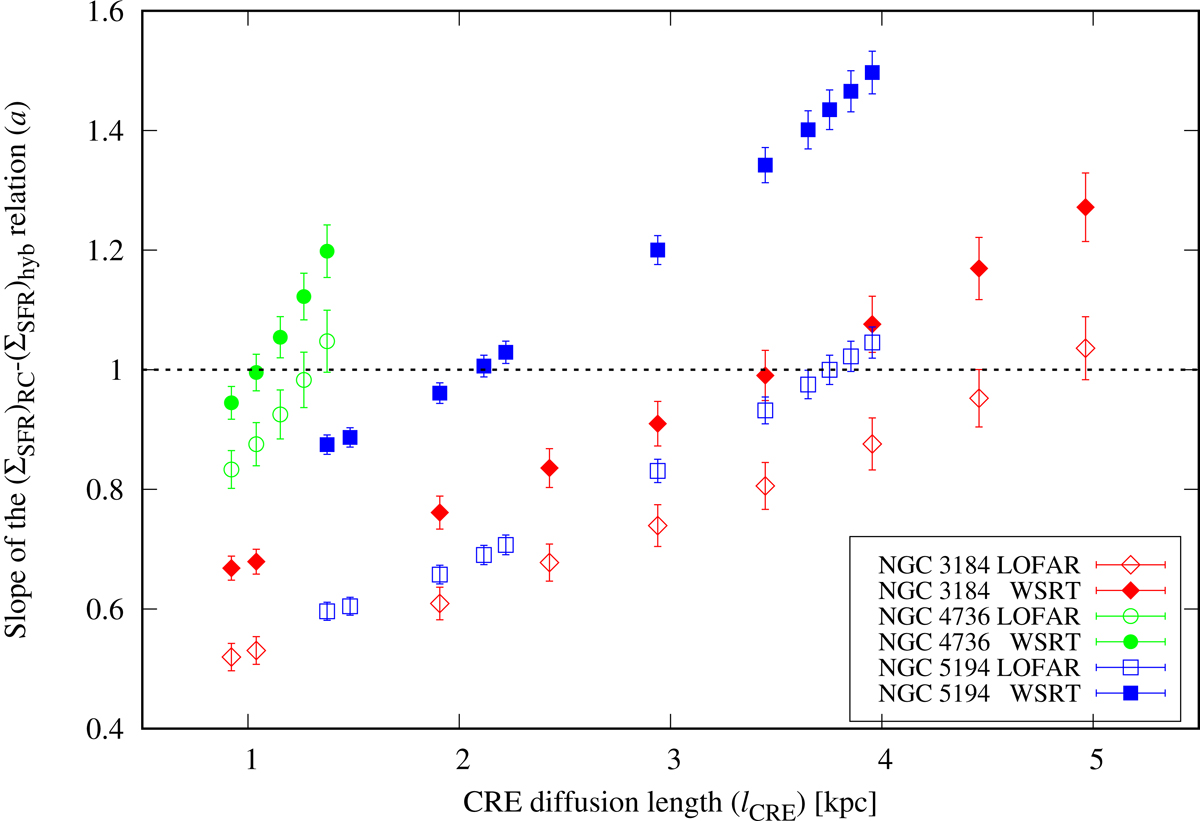
Smoothing experiment to measure the CRE diffusion length. Plotted is the slope of the (ΣSFR)RC–(ΣSFR)hyb relation, a, as function of the CRE diffusion length lCRE. LOFAR 140 MHz data are shown as open and WSRT 1365 MHz data are shown as filled symbols. The three galaxies are represented by red (NGC 3184), green (NGC 4736), and blue (NGC 5194).
Current usage metrics show cumulative count of Article Views (full-text article views including HTML views, PDF and ePub downloads, according to the available data) and Abstracts Views on Vision4Press platform.
Data correspond to usage on the plateform after 2015. The current usage metrics is available 48-96 hours after online publication and is updated daily on week days.
Initial download of the metrics may take a while.