Fig. 4.
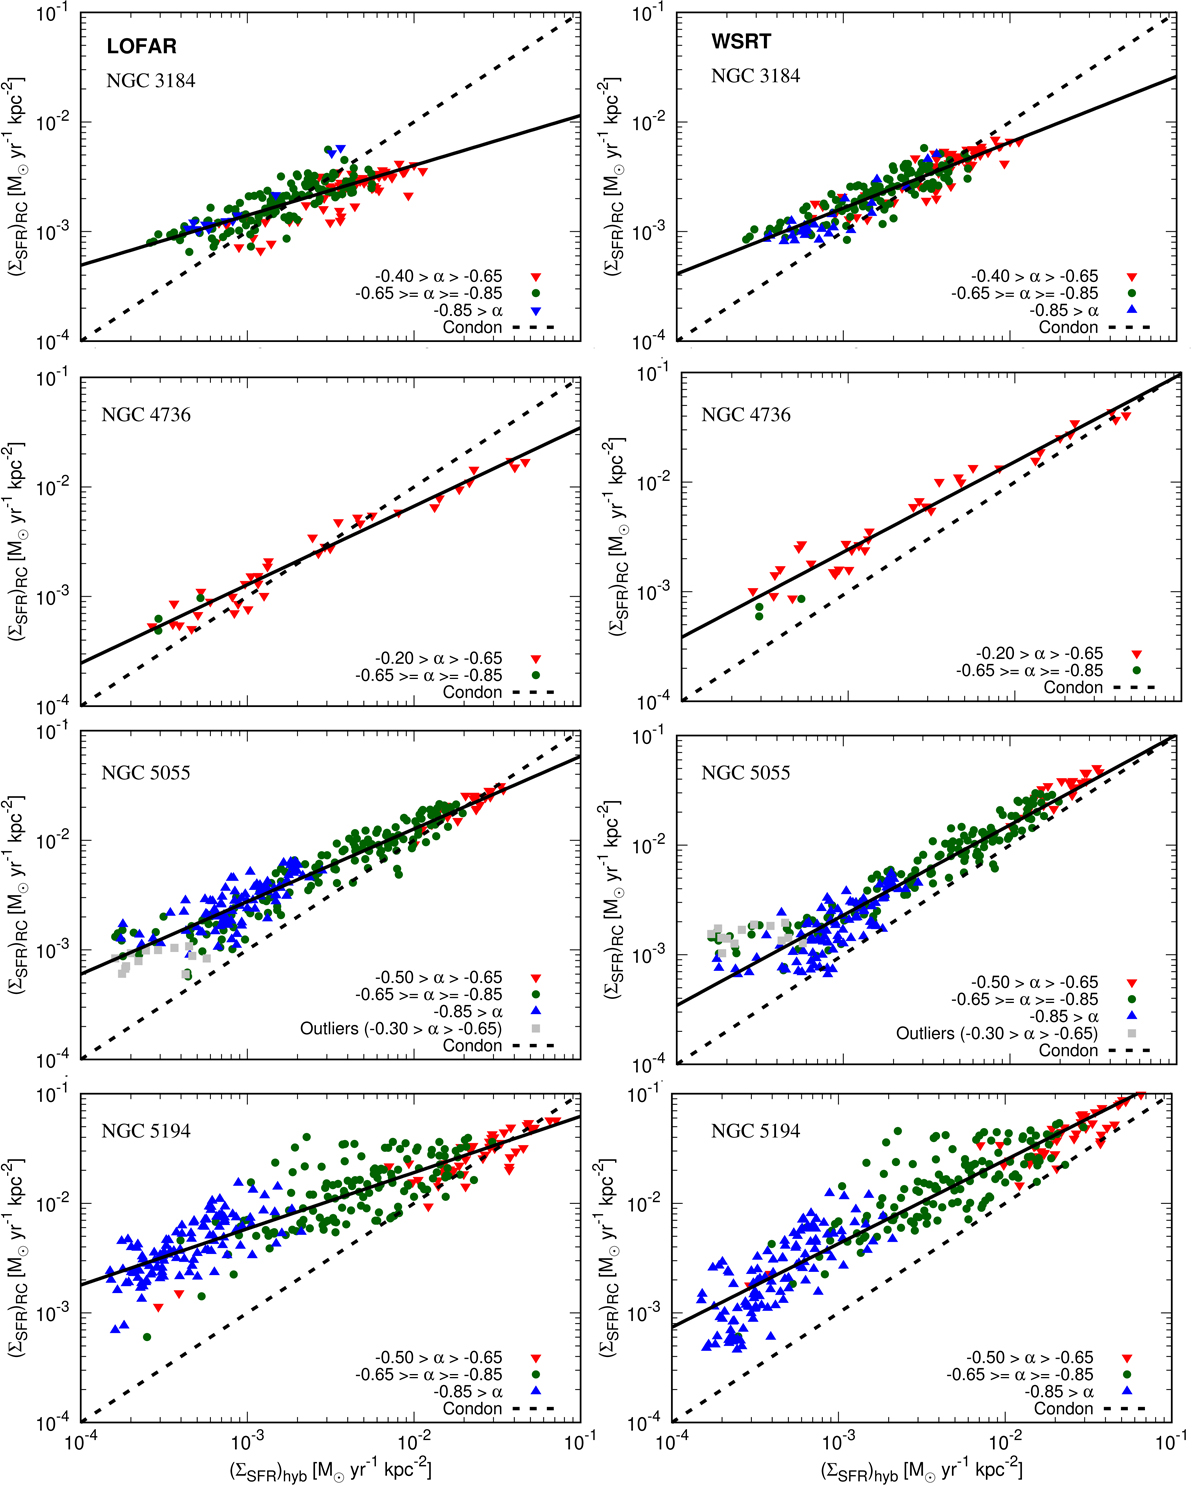
Plot of the individual galaxies, showing the spatially resolved RC–SFR ((ΣSFR)RC–(ΣSFR)hyb) relation. Each data point represents a 1.2 × 1.2 kpc2 region that has been obtained from the hybrid ΣSFR map (abscissa) and from the radio ΣSFR map (ordinate). Shape and colour represent different radio spectral indices between 140 and 1365 MHz. Downward-pointing red triangles represent regions with young CREs (−0.65 < α < −0.20); filled green circles represent regions with CREs of intermediate age (−0.85 ≤ α ≤ −0.65); and upward-pointing blue triangles represent regions with old CREs (α < −0.85). Solid black lines show the best-fitting relation and dashed lines show the Condon relation. Left panels: results for LOFAR 140 MHz and right panels: for WSRT 1365 MHz. A 3σ cut-off was applied in all maps.
Current usage metrics show cumulative count of Article Views (full-text article views including HTML views, PDF and ePub downloads, according to the available data) and Abstracts Views on Vision4Press platform.
Data correspond to usage on the plateform after 2015. The current usage metrics is available 48-96 hours after online publication and is updated daily on week days.
Initial download of the metrics may take a while.