Fig. A.5.
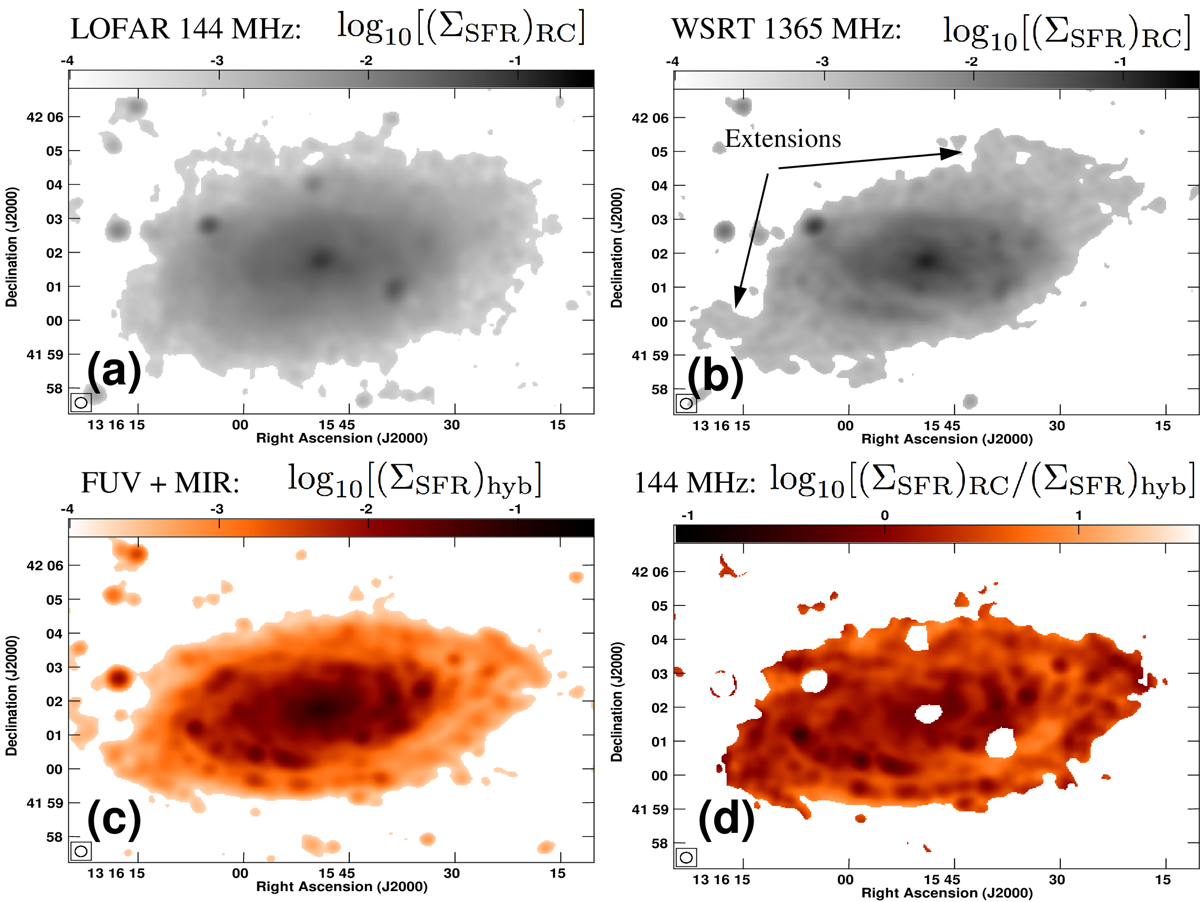
NGC 5055. Panel a: RC emission at 144 MHz, as derived from the LOFAR HBA observations. The intensities were converted into a map of the radio ΣSFR map, using the 1.4 GHz relation of Condon scaled with a radio spectral index of −0.8. This map is shown at a logarithmic stretch ranging from 10−4 to 3 × 10⁻¹ M⊙ yr−1 kpc−2. Panel b: same as panel a, but using a 1365 MHz map from WSRT–SINGS. Panel c: hybrid ΣSFR map, derived from a linear superposition of GALEX 156 nm FUV and Spitzer 24 μm MIR emission, presented as inverted heat colour scale. Panel d: ratio of the LOFAR (ΣSFR)RC map divided by the hybrid (ΣSFR)hyb map. The map is shown at logarithmic stretch using the heat colour scale ranging from 10−0.6 to 101.6. Areas that are light are radio bright, whereas dark areas are radio dim when compared with the hybrid ΣSFR map. All maps have been convolved to a circular Gaussian beam with a resolution of 19.1 × 19.1 arcsec2. The representation of the beam is shown in the bottom left corner of each panel. Panel a–c show unmasked maps, whereas panel d shows the area after masking background sources and the AGN-contaminated central area. In all panels, a 3σ cut-off has been applied.
Current usage metrics show cumulative count of Article Views (full-text article views including HTML views, PDF and ePub downloads, according to the available data) and Abstracts Views on Vision4Press platform.
Data correspond to usage on the plateform after 2015. The current usage metrics is available 48-96 hours after online publication and is updated daily on week days.
Initial download of the metrics may take a while.