Fig. 1.
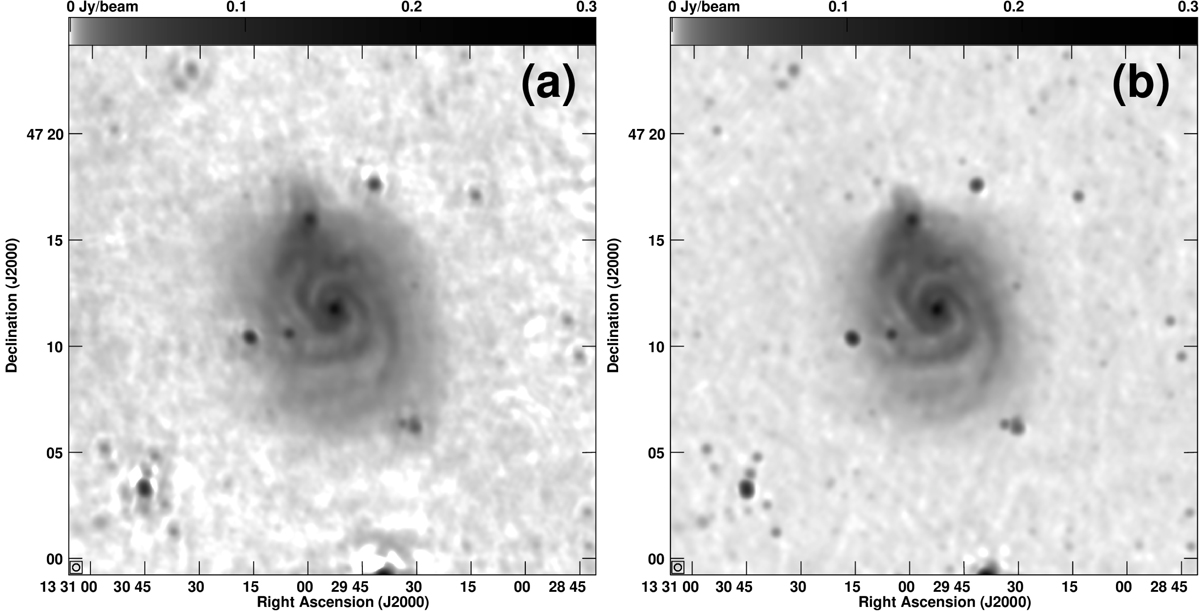
NGC 5194. Panel a: RC emission at 151 MHz, as derived from LOFAR HBA observations (Mulcahy et al. 2014). The map has been calibrated with direction-independent phase calibration only. Panel b: RC emission at 145 MHz, obtained from the same data set as panel a but calibrated with direction-dependent phase and amplitude calibration. Both maps are presented with a logarithmic transfer function and have an angular resolution of 20 × 20 arcsec2, as indicated by the circle in the bottom left corner.
Current usage metrics show cumulative count of Article Views (full-text article views including HTML views, PDF and ePub downloads, according to the available data) and Abstracts Views on Vision4Press platform.
Data correspond to usage on the plateform after 2015. The current usage metrics is available 48-96 hours after online publication and is updated daily on week days.
Initial download of the metrics may take a while.