Fig. 4.
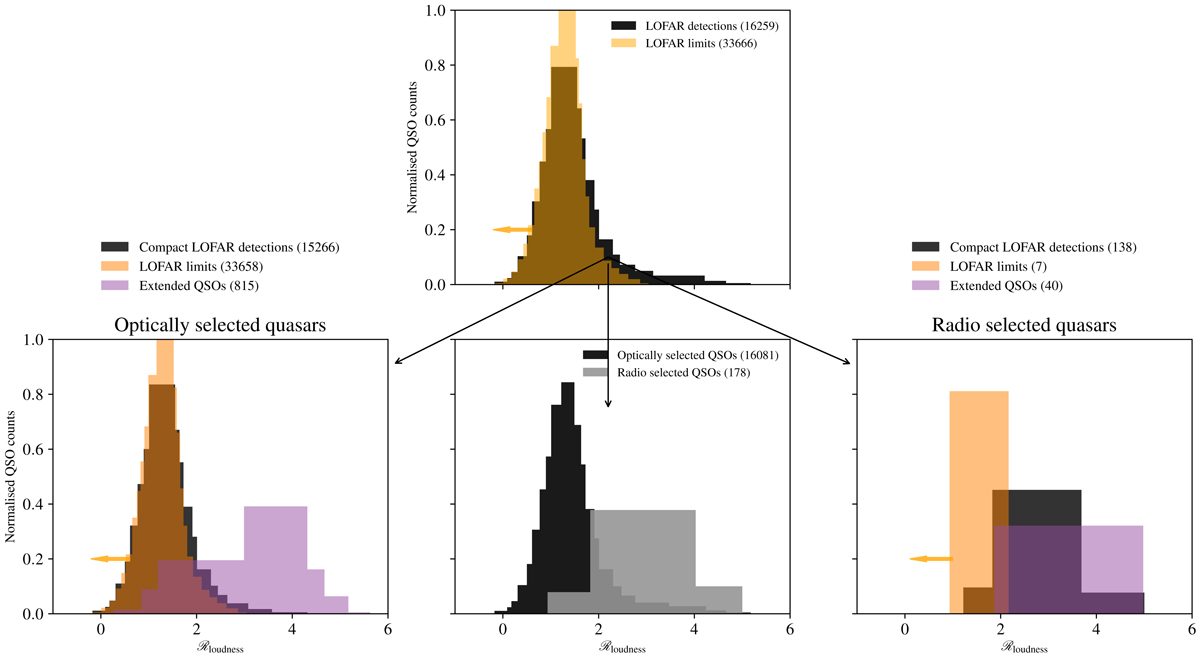
Top: histogram of radio loudness parameter ℛ derived using L144 and SDSS i-band measurements of the whole sample. Black: LOFAR 3σ detections; orange: LOFAR limits. Bottom middle: histogram of ℛ of the LOFAR detected sources, split based on their selections (i.e. optically selected and radio selected). Grey: Radio selected quasars; black: optically selected quasars. Bottom left: histogram of ℛ of optically selected quasars. Black: LOFAR 3σ detections; orange: LOFAR limits; and purple: extended sources. Bottom right: histogram of ℛ quasars selected based on their match to the FIRST counterparts. Colours as for the bottom left panel. Optimal bin widths were selected using the Bayesian blocks formalism given by Ivezić et al. (2014).
Current usage metrics show cumulative count of Article Views (full-text article views including HTML views, PDF and ePub downloads, according to the available data) and Abstracts Views on Vision4Press platform.
Data correspond to usage on the plateform after 2015. The current usage metrics is available 48-96 hours after online publication and is updated daily on week days.
Initial download of the metrics may take a while.