Fig. 3.
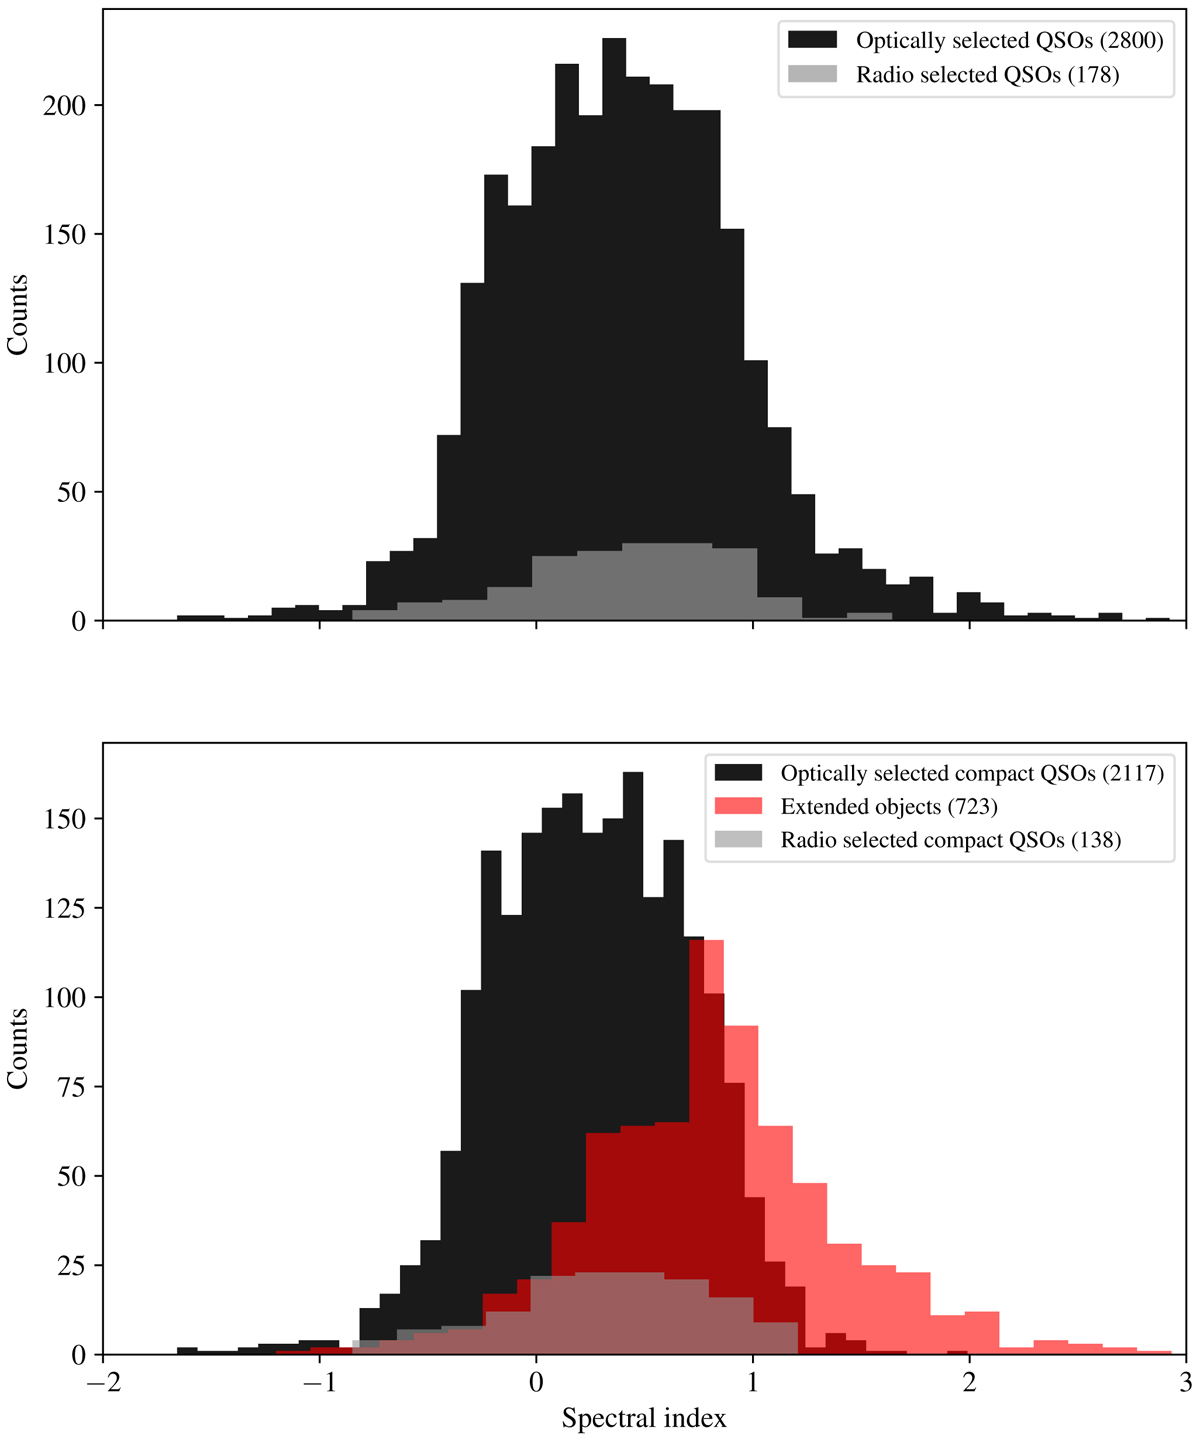
Top: distribution of α of quasars calculated using LOFAR and FIRST flux densities. The distribution is shown for quasars detected by both LOFAR and FIRST, separately for optically selected and radio selected quasars. Bottom: the distribution of α of optically, radio selected and objects presenting extended structures. Optimal bin widths were selected using the Knuth rule (Deeming 1975; Ivezić et al. 2014).
Current usage metrics show cumulative count of Article Views (full-text article views including HTML views, PDF and ePub downloads, according to the available data) and Abstracts Views on Vision4Press platform.
Data correspond to usage on the plateform after 2015. The current usage metrics is available 48-96 hours after online publication and is updated daily on week days.
Initial download of the metrics may take a while.