Fig. 12.
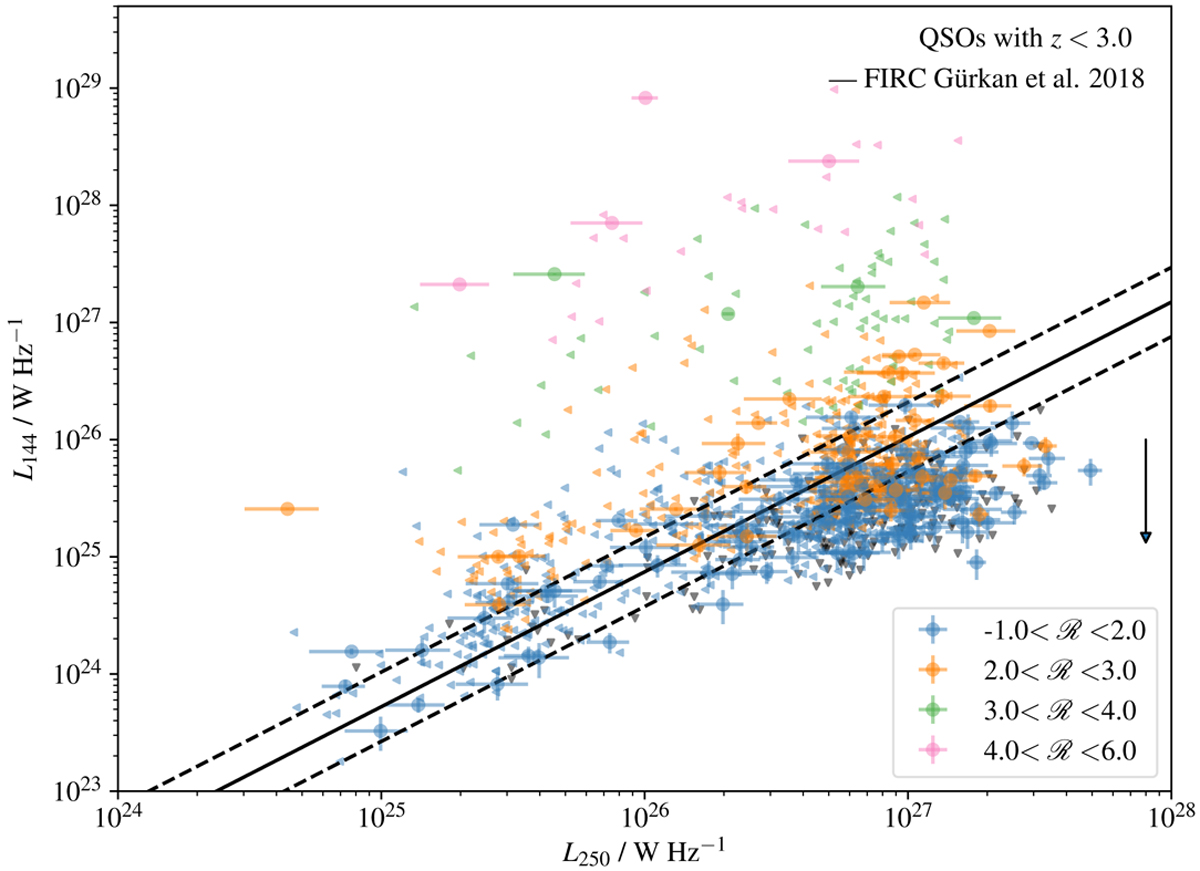
Distribution of L144 of quasars with z < 3.0 as a function of L250. The solid black line shows the FIRC relation given by Gürkan et al. (2018). Circles indicate sources detected in both bands: left-pointing arrows and black down-pointing arrows represent limits in 250 μm and 144 MHz bands. Points (except LOFAR limits) are colour coded by their ℛ values. We expect to get a flatter slope with increasing redshift due to the evolution of FIRC (Calistro Rivera et al. 2017), which is indicated by a black arrow.
Current usage metrics show cumulative count of Article Views (full-text article views including HTML views, PDF and ePub downloads, according to the available data) and Abstracts Views on Vision4Press platform.
Data correspond to usage on the plateform after 2015. The current usage metrics is available 48-96 hours after online publication and is updated daily on week days.
Initial download of the metrics may take a while.