Fig. 5.
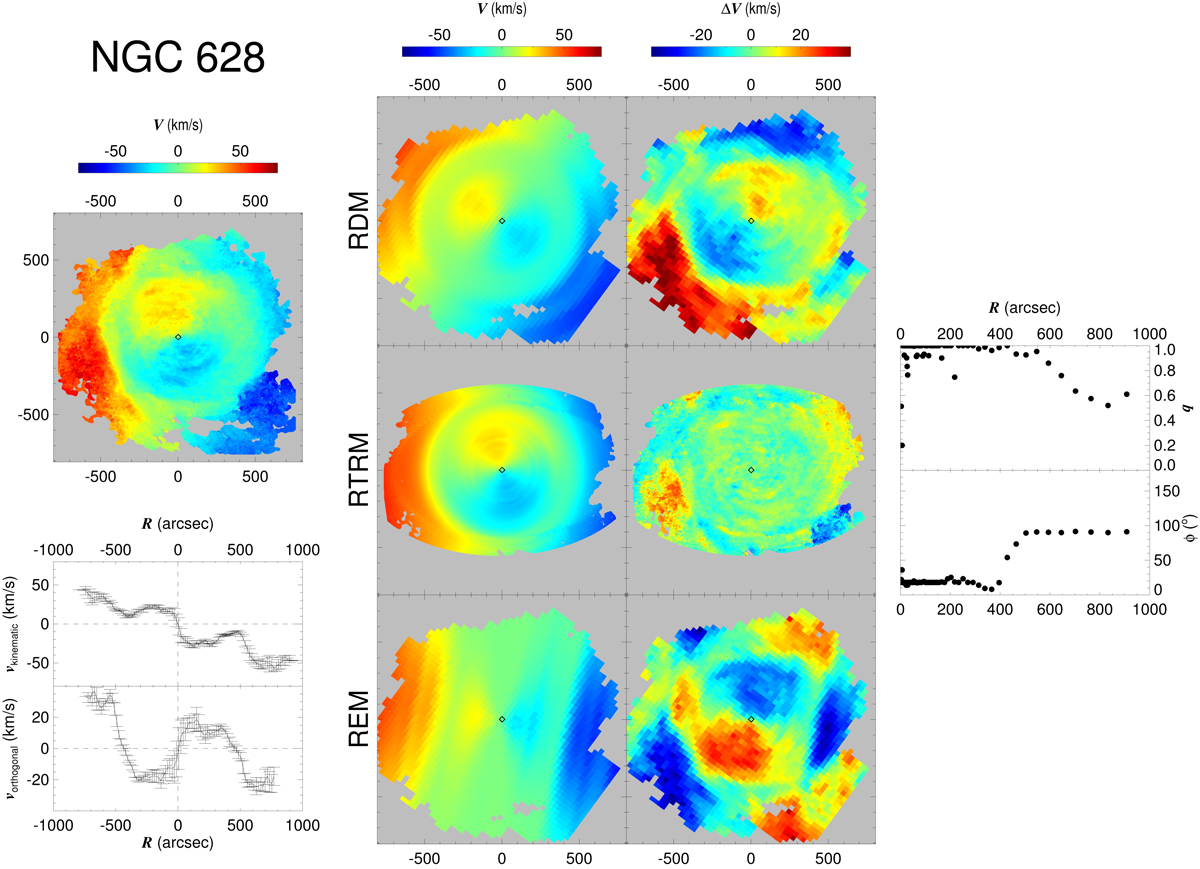
NGC 628. Left panels: observed velocity profile (upper panel) and the velocity profile along the kinematic axis and along the axis orthogonal to it (bottom panels). The color-code of the velocity and residual fields is given in km s−1, where the systemic velocity of the object has been subtracted. Center panels from top to bottom: rotating disk model (RDM) velocity field (left), residual fields (right). Same as above but for the rotating tilted-ring model (RTRM) and radial ellipse model (REM). Right panels: axial ratio (upper panel) and the position angle as a function of the distance from the center (bottom panel).
Current usage metrics show cumulative count of Article Views (full-text article views including HTML views, PDF and ePub downloads, according to the available data) and Abstracts Views on Vision4Press platform.
Data correspond to usage on the plateform after 2015. The current usage metrics is available 48-96 hours after online publication and is updated daily on week days.
Initial download of the metrics may take a while.