Fig. 2
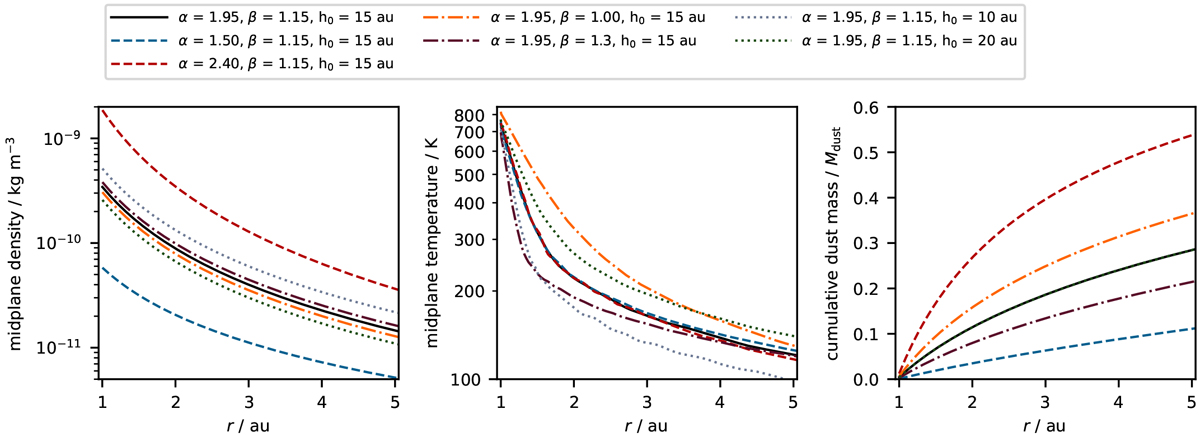
Physical properties of the innermost region of different disc models. The dust density distribution in the disc midplane (left panel), the midplane temperature (middle panel), and the cumulative dust mass (right panel) are shown for the reference model from the centre of the parameter space (solid line), different radial density slopes (α, dashed lines), disc flarings (β, dashed-dotted lines), and scale heights (h0, dotted lines).
Current usage metrics show cumulative count of Article Views (full-text article views including HTML views, PDF and ePub downloads, according to the available data) and Abstracts Views on Vision4Press platform.
Data correspond to usage on the plateform after 2015. The current usage metrics is available 48-96 hours after online publication and is updated daily on week days.
Initial download of the metrics may take a while.