Open Access
Fig. 1
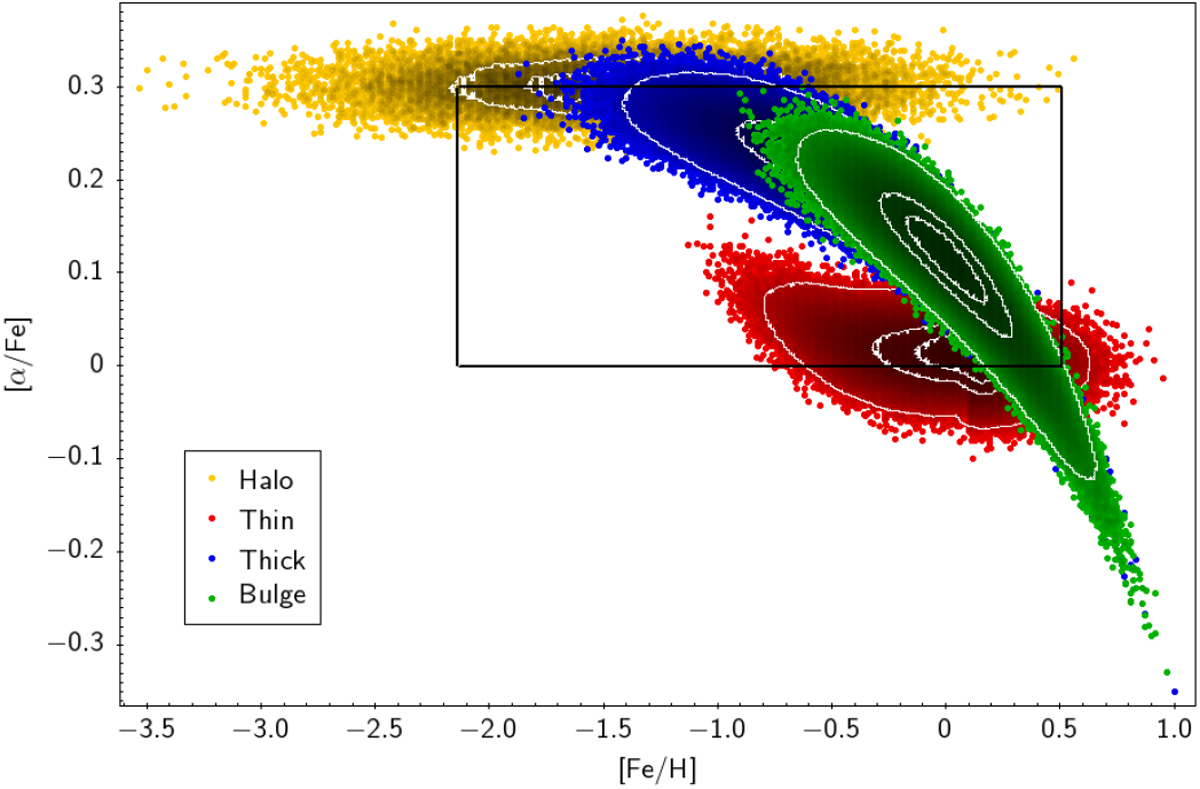
[α/Fe] abundance as a function of [Fe/H] for stars with d < 50 kpc simulated with the BGM. Thin and thick disks as well as bulge and halo stars are represented by red, blue, green, and yellow dots, respectively. Black lines indicate the selected population we used here: −2.14 < [Fe/H] < 0.51 and 0 < [α/Fe] < 0.3.
Current usage metrics show cumulative count of Article Views (full-text article views including HTML views, PDF and ePub downloads, according to the available data) and Abstracts Views on Vision4Press platform.
Data correspond to usage on the plateform after 2015. The current usage metrics is available 48-96 hours after online publication and is updated daily on week days.
Initial download of the metrics may take a while.