| Issue |
A&A
Volume 622, February 2019
|
|
|---|---|---|
| Article Number | L2 | |
| Number of page(s) | 5 | |
| Section | Letters to the Editor | |
| DOI | https://doi.org/10.1051/0004-6361/201833682 | |
| Published online | 24 January 2019 | |
Letter to the Editor
Discovery and follow-up of the unusual nuclear transient OGLE17aaj
1
Warsaw University Astronomical Observatory, Al. Ujazdowskie 4, 00-478 Warszawa, Poland
e-mail: This email address is being protected from spambots. You need JavaScript enabled to view it.
2
European Southern Observatory, Karl Schwarzschild Str 2, 85748 Garching, Germany
3
IAASARS, National Observatory of Athens, Vas. Pavlou & I. Metaxa, Penteli 15236, Greece
4
Sternberg Astronomical Institute, Moscow State University, Universitetsky pr. 13, Moscow 119991, Russia
5
Lebedev Physical Institute, Astro Space Center, Profsoyuznaya 84/32, Moscow 117997, Russia
6
School of Physics, O’Brien Centre for Science North, University College Dublin, Belfield Dublin 4, Ireland
7
Harvard-Smithsonian Center for Astrophysics, 60 Garden St, Cambridge, MA 02138, USA
8
Department of Physics, University of California, Santa Barbara, CA 93106-9530, USA
9
Las Cumbres Observatory, 6740 Cortona Dr Ste 102, Goleta, CA 93117-5575, USA
10
The Raymond and Beverly Sackler School of Physics and Astronomy, Tel Aviv University, Tel Aviv 69978, Israel
11
Department of Physics, ETH Zurich, Wolgang-Pauli-Str. 27, Zurich 8093, Switzerland
12
SRON, Netherlands Institute for Space Research, Sorbonnelaan 2, 3584 CA Utrecht, The Netherlands
13
Department of Astrophysics/IMAPP, Radboud University, PO Box 9010, 6500 GL Nijmegen, The Netherlands
14
Tuorla Observatory, Department of Physics and Astronomy, University of Turku, Väisäläntie 20, 21500 Piikkiaö, Finland
15
Ohio State University, Department of Astronomy, 140 West 18th Avenue, Columbus, OH 43210, USA
16
Department of Physics, University of Warwick, Gibbet Hill Road, Coventry CV4 7AL, UK
17
Department of Astronomy, The Oskar Klein Center, Stockholm University, AlbaNova 10691, Stockholm, Sweden
18
Astrophysics Research Centre, School of Mathematics and Physics, Queens University Belfast, Belfast BT7 1NN, UK
19
School of Physics & Astronomy, University of Southampton, Southampton SO17 1BJ, UK
20
Department of Particle Physics and Astrophysics, Weizmann Institute of Science, 234 Herzl St., Rehovot, Israel
21
Max-Planck-Institut für Extraterrestrische Physik, Giessenbachstr. 1, 85748 Garching, Germany
22
South African Astronomical Observatory, PO Box 9, Observatory 7935, South Africa
Received:
20
June
2018
Accepted:
4
January
2019
Abstract
Aims. We report on the discovery and follow-up of a peculiar transient, OGLE17aaj, which occurred in the nucleus of a weakly active galaxy. We investigate whether it can be interpreted as a new candidate for a tidal disruption event (TDE).
Methods. We present the OGLE-IV light curve that covers the slow 60-day-long rise to maximum along with photometric, spectroscopic, and X-ray follow-up during the first year.
Results. OGLE17aaj is a nuclear transient exhibiting some properties similar to previously found TDEs, including a long rise time, lack of colour-temperature evolution, and high black-body temperature. On the other hand, its narrow emission lines and slow post-peak evolution are different from previously observed TDEs. Its spectrum and light-curve evolution is similar to F01004-2237 and AT 2017bgt. Signatures of historical low-level nuclear variability suggest that OGLE17aaj may instead be related to a new type of accretion event in active super-massive black holes.
Key words: black hole physics / Galaxy: nucleus
Einstein Fellow.
Zwicky Fellow.
© ESO 2019
1. Introduction
Transients in the centres of galaxies are challenging to discover and study. However, an increasing number of such flares is being detected by wide-field sky surveys, such as iPTF (Blagorodnova et al. 2017), Pan-STARRS (Lawrence et al. 2016), and OGLE (Wyrzykowski et al. 2017). A variety of flaring mechanisms have been suggested to explain these discoveries, which range from supernovae, changing-look active galactic nuclei (AGN; e.g. LaMassa et al. 2015), extreme AGN flares of unclear nature (e.g. Graham et al. 2017), or tidal disruption events (TDEs). A TDE occurs when a star passing near a super-massive black hole (SMBH) residing in the centre of a galaxy is disrupted by tidal forces. Roughly half of the material of the disrupted star forms an accretion flow around the SMBH (Rees 1988). The interaction of the matter in the accretion flow produces a bright, blue flare that lasts from months to years. For SMBHs with mass ≲106 M⊙, the flare amplitude is expected to be an order of magnitude lower than for a ≳107 M⊙ SMBH, resulting in lower peak luminosities and posing additional challenges for detection (Guillochon & Ramirez-Ruiz 2015). The absolute magnitude of a TDE in the optical can be very bright and may reach M = −20 or even up to M = −23 (Arcavi et al. 2014; Leloudas et al. 2016). However, the recent discovery of the fast and faint event iPTF16fnl (Blagorodnova et al. 2017) suggests that the population might also extend to fainter peak magnitudes.
The estimated TDE rate is about one per 104−105 years per galaxy (Wang & Liu 2016; Stone & Metzger 2016). However, most optically selected TDEs have been discovered in post-starburst (E+A) galaxies (Arcavi et al. 2014), which are elliptical galaxies with an atypically large population of young A-type stars. It is not clear whether these rates also apply to other types of hosts, as some recent TDE candidates have been found in different types of galaxies: in weak AGN (OGLE16aaa; Wyrzykowski et al. 2017) or ultra-luminous infrared galaxies (ULIRGs; Tadhunter et al. 2017; Mattila et al. 2018). These discoveries show that our current knowledge of TDE demographics is far from complete.
We here report the discovery and early follow-up of a nuclear transient, OGLE17aaj, which shares spectral features with F01004-2237 (Tadhunter et al. 2017). Recently, another transient (AT 2017bgt) exhibited similar properties, and its TDE interpretation has been strongly disfavoured (Trakhtenbrot et al. 2019). Understanding the nature of OGLE17aaj can therefore shed light on this type of phenomena. In Sect. 2 we describe the observations, and we present the results in Sect. 3. We discuss the results in Sect. 4 by comparing OGLE17aaj to other known TDEs. We summarise in Sect. 5. We adopt the following cosmological parameters: H0 = 70 km s−1 Mpc−1, Ωm = 0.28, and ΩΛ = 0.72.
2. Observations
OGLE17aaj is located at αJ2000 = 01:56:24.93, δJ2000 = −71:04:15.7. We measured this position to be  (equivalent to 0.21 ± 0.27 kpc at z = 0.116) from the centre of its host galaxy, GALEXASC J015624.70−710415.8, and it is therefore coincident with the host nucleus.
The transient was discovered on the night of 2017 January 2 (Gromadzki et al. 2017) by the OGLE-IV Transient Detection System (Wyrzykowski et al. 2014; Klencki et al. 2016). The field within which OGLE17aaj was found has been systematically monitored since 2010 by the OGLE-IV project, with cadences of 5–10 days and two months in I and V band, respectively. The limiting magnitudes in both bands are about 22m (Vega). Difference-imaging photometry at the position of OGLE17aaj was extracted using a stack of the best-seeing images taken prior to the flare as a deep reference image. Details of OGLE-IV can be found in Udalski et al. (2015). The earliest detection of the event dates from 2016 October 30, and the event reached its I-band maximum around 2017 January 4. OGLE collected 112 and 9 observations in I and V band, respectively.
OGLE17aaj was observed using the 8.2 m Antu telescope of the Very Large Telescope (VLT) with FORS2 in long-slit mode. Observations were taken on the nights of 2017 January 15, February 2, and 27 and October 6, under seeing conditions of  , and at air masses 1.7–2.0. The first and last spectra were taken with the G300V grism, and the remaing were taken with G600B. In all cases the exposure time was 974 s. These spectra were bias-corrected, flatfielded, extracted, and wavelength and flux calibrated using calibration frames provided by ESO and standard IRAF procedures.
The transient was also observed using the 3.5 m New Technology Telescope at La Silla, using the EFOSC2 spectrograph with Gr11. Observations were taken on the nights of 2017 January 20 and 26 and February 19 under good conditions, with seeing of  , and at an air mass of ∼1.7, as part of the PESSTO ESO public survey (Smartt et al. 2015). The exposure time for each spectrum was 2700 s. All EFOSC2 spectra were reduced using the PESSTO pipeline.
An additional spectrum was obtained with the Southern African Large Telescope (SALT) using the Robert Stobie Spectrograph (RSS), equipped with the PG300 grating. Two exposures of 1200 s were taken on 2017 August 18, under good conditions with a seeing of  and an air mass ∼1.3. Basic reductions were performed using the PySALT package (Crawford et al. 2010), and IRAF was used for extraction and wavelength and flux calibration.
The Neil Gehrels Swift Observatory (Swift; Gehrels et al. 2004) observed OGLE17aaj for 14 epochs (19.1 ks total exposure time) between 2017 January 24 and September 9, with both the X-Ray Telescope (XRT; Burrows et al. 2005; operating in the photon counting mode) and the Ultra-Violet/Optical Telescope (UVOT; Roming et al. 2005). The UVOT calibration of Poole et al. (2008) and Breeveld et al. (2010) was used to convert UVOT count rates into magnitudes and flux densities. We used archival GALEX flux measurements for host subtraction.
3. Results
OGLE17aaj was detected at a host-subtracted I-band magnitude of about  and reached an I-band maximum of 20m in about 60 days (Fig. 1). The transient then declined for about 200 days and appears to subsequently have reached a plateau. The UV measurements follow the trend seen in optical observations. At maximum, the transient reached
  and
and  on galaxy-subtracted Swift images, which corresponds to an increase in UV flux by a factor of ∼16 compared to archival GALEX measurements. The estimated peak absolute magnitude of OGLE17aaj in the I band is
  . Because the transient is not yet completed, we can derive the lower limit on the total energy emitted until now as about 7 × 1051 ergs, which corresponds to a lower limit of the accreted mass of Macc ∼ 0.04 M⊙, assuming a radiating efficiency of 0.1.
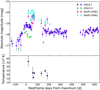 |
Fig. 1. Upper panel: host-subtracted photometry of OGLE17aaj in the OGLE-IV I and V bands and the Swift UVW1 and UVW2 bands in absolute magnitudes as a function of days since maximum. Lower panel: temperature evolution derived from Swift ultraviolet data over the same period. |
The UV source associated with the host galaxy is listed in the GALEX catalogue (Bianchi et al. 2011) as GALEXASC J015624.70−710415.8, with far-UV (FUV) AB magnitudes of  and near-UV (NUV)
  . No X-ray sources are detected in the ROSAT all-sky survey (Boller et al. 2016) in the vicinity of this galaxy. No radio catalogues comparable in depth to the ATCA post-outburst observations (non-detection at the 50 μJy level at 5 and 9 GHz; Stanway et al. 2017) cover this region of the sky. The deepest surveys are the AT20G survey, conducted at 20 GHz with ATCA (flux-density limit of 40 mJy; Murphy et al. 2010) and the GLEAM survey at 72–231 MHz with the Murchison Widefield Array (50 mJy; Hurley-Walker et al. 2017). The host was measured by the Wide-Field Infrared Survey Explorer,
  , and
, and  (AllWISE; Wright et al. 2010; Cutri et al. 2013). Photometric data for this galaxy can also be found in the USNO-B1.0 catalogue (Monet et al. 2003). We used these archival data, that is, broad-band magnitudes from GALEX, USNO-B1.0, and AllWISE, to estimate the spectral energy density (SED) of the host before the appearance of the transient (following Kozłowski 2015). To fit the SED, we used the low-resolution templates of AGN and galaxies from Assef et al. (2010). The best-matching template to explain the observed SED comprised an elliptical galaxy plus an AGN, but the residuals of the host light Sérsic model fit with GALFIT (Peng et al. 2010) indicate weak spiral arms.
The classification spectrum, taken ten days after maximum (Fig. 2), revealed a flat continuum with many prominent emission lines: hydrogen Balmer lines, He I λ5876, He II λ4686, [O III] λλ4960, 5007, [O II] λ3727, and [S II] λλ6718, 6732. The lines are at a redshift of z = 0.116, which corresponds to a luminosity distance of 540 Mpc. The spectrum looks very similar to the spectra of F01004-2237 from September 2015, that is, to spectra taken around five years after its maximum, when the transient was still ongoing. The shape of the line complex around He II λ4686 in particular is very similar (see Fig. 2). It has a double-peaked structure, where the bluer broad component can be associated with N III λ4640, or blue-shifted He II. The FWHM of the combined double feature, ∼5000 km s−1, is also very similar in both objects. The line ratio of (N III+He II)/Hβ ≈ 0.9 is twice lower than in F01004-2237, while typical quasars have ∼0.02 (Vanden Berk et al. 2001).
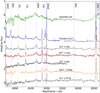 |
Fig. 2. Sequence of spectra obtained for OGLE17aaj. VLT observations are marked in black, those from the NTT in red, and SALT observations are shown in orange. The upper two spectra are of F01004-2237 (Tadhunter et al. 2017) and a typical TDE, ASASSN-14li (Holoien et al. 2016), for comparison. |
During the first two months of spectroscopic follow-up, the spectrum of OGLE17aaj essentially remained stable. The equivalent widths of the emission lines varied at a level of 20 percent. However, it is unclear whether these are caused by real, astrophysical effects or by the varying quality of the spectra, which were usually taken at high air masses (1.7–2). After a seasonal gap, we took another SALT spectrum, in which the double-peak profile around He II disappeared and only one emission feature remained. This spectrum also shows a decrease in the flux of the Hβ and Hα emission lines (by a factor of 3 and 1.5, respectively). We are unable to compare the SALT +226d spectrum with previous VLT spectra in detail because SALT used a slit that is twice as wide, and therefore the contribution from host emission was more significant. We took an additional VLT spectrum with the same configuration as the first, which shows that the intensities of He II and Hγ decrease by a factor of ∼3, and Hδ practically disappeared. We also attempted to estimate the position of the host on the BPT diagnostic diagram, but because our spectra contain both the host and transient, the line measurements were strongly affected by the transient, which increased the flux in hydrogen lines. Such measurement will be possible after the transient is completed.
The shape of the continuum is rather flat, although Swift colours suggest a high temperature of ∼20 000 K, and it recalls those in Seyfert type II galaxies. The main difference is the presence of N III+He II emission, and the Balmer emissions are also much stronger. Most likely, an underlying, persistent AGN continuum contributes to the optical spectrum, and the difference imaging therefore merely shows that the variable component of this flat continuum is blue. A behaviour like this is also seen in variable AGN (e.g. Hung et al. 2016).
A weak X-ray source is detected at the 4σ confidence level in the stacked Swift/XRT image at the position of the transient, with a net count rate of 0.0011 ± 0.0003 cts/s. When we fix the H I column density to the Galactic value along this line of sight (5.53 × 1020 cm−2; Bajaja et al. 2005; Kalberla et al. 2005), the spectrum can be fitted by an absorbed power law with a photon index of 2.5 ± 0.6 and an intrinsic 0.3–10 keV flux of 4.5 × 10⁻¹⁴ ergs cm−2 s−1. The corresponding intrinsic luminosity in this band is 1.57 × 1042 ergs s−1. The flux estimation uncertainty is about 40%. The [O III] λ5007 to hard X-ray ratio is consistent with what is typically seen in X-ray detected, low-redshift AGN (e.g. Berney et al. 2015, and references therein).
No detectable X-ray emission is found in individual observations with a typical upper limit of 0.002 cts/s (8 × 10⁻¹⁴ ergs cm−2 s−1). Taking into account the Galactic reddening of  (Schlafly & Finkbeiner 2011), we estimated the colour temperature (Fig. 1, bottom panel) using the three Swift/UVOT ultraviolet filters, where the host light contribution is minimal. We estimated the mass of the SMBH using the properties of the host galaxy based on the pre-transient imaging. The fraction of the light from the bulge with respect to the total flux emitted by the galaxy, measured with GALFIT on a deep stack of V-band archival OGLE images, is 19.8%, which yields log MBH = 7.37 using the method of Bentz et al. (2009).
Additionally, the archival OGLE-IV I-band light curve, covering six years before the transient, shows a small-scale irregular variability at a level of 10%, which is significantly lower than the flare itself (Fig. 3) and indicates on-going accretion onto the SMBH.
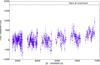 |
Fig. 3. OGLE I-band host-subtracted flux measurement at the centre of the host galaxy before the transient, covering 2010–2016. The horizontal line shows the maximum flux level reached by OGLE17aaj in 2017. |
4. Discussion
The UV and optical light curves of OGLE17aaj indicate no or slow colour-temperature change over the entire monitoring period. Temperatures as high as 4 × 10⁴ K at maximum are not typical of supernovae, but are seen in TDEs (e.g. Gezari et al. 2012; Arcavi et al. 2014). The peak absolute magnitude of OGLE17aaj (MI = −18.8) is fainter than in most known optical TDEs and exceeds −20m. Nevertheless, it is not the first example of such a faint event, as the faint TDE iPTF16fnl reached only Mg = −17.2 (Blagorodnova et al. 2017).
The light curve from OGLE-IV shows a well-covered, smooth, and long-duration rise to maximum. Most of the TDEs reported so far hardly ever had such a good pre-discovery coverage. While the slow rise of OGLE17aaj could still be in agreement with an interpretation as a TDE, the decline is much slower (about 0.5 mag/year). In particular, the flattening of the light curve after 200 days has never been seen in any TDE. The light curve of OGLE17aaj is somewhat similar to the changing-look AGN SDSS J233317 (MacLeod et al. 2016), but the spectrum of that object does not have the characteristic He II+N III feature seen in OGLE17aaj. This suggests that OGLE17aaj may be related to a change in the state of the AGN rather than a TDE.
A broad (∼30 000 km s−1) He II line component is the most typical feature of most TDEs (e.g. Arcavi et al. 2014). However, in the case of OGLE17aaj, this emission line is significantly narrower at ∼5000 km s−1. The He II profile is irregular and is very similar to what is seen in the F01004-2237 event five years after its maximum (Tadhunter et al. 2017). The complex feature around He II λ4686 in F01004-2237 was explained with a large population of ∼104 Wolf-Rayet stars (WR), and with an additional blue-shifted helium line with an FWHM ∼ 6200 km s−1, which, according to Tadhunter et al. (2017), originated from a TDE.
The host of OGLE17aaj shows weak levels of AGN activity. In contrast to F01004-2237, it has a negligible WR population. However, the similar optical spectra and the slow photometric evolution suggest that they may be driven by a similar phenomenon. We note that the estimated black hole mass for the SMBH we associate with OGLE17aaj is an order of magnitude lower than in the case of F01004-2237. Both the archival photometric variability of the nucleus and narrow lines in the spectrum originating from the host indicate that the nucleus of the galaxy is active at a low level. If the SMBH has been accreting in the past, the observed greater change in brightness fits the overall picture of a rapid change in the accretion rate.
Recently, Trakhtenbrot et al. (2019) have reported the discovery of the transient AT 2017bgt, which showed optical features that are very similar to those seen in OGLE17aaj, as well as a similar photometric evolution. High-quality near-IR and optical spectra of AT 2017bgt showed single-peaked He II lines, which rules out a disk origin for the double-peak profile in the broad feature associated with He II λ4686, and thus suggests that the bluer peak originates from N III λ4640. They also identified several blue O III lines and argued that the O III and N III features are produced by the Bowen fluorescence mechanism, which is driven by enhanced accretion of gas onto an existing AGN. This further disfavours a TDE.
5. Conclusions
We reported the discovery and early follow-up observations of the unusual nuclear transient OGLE17aaj. We investigated it as a potential TDE candidate based on its high black-body temperature and on the similarity of its spectrum to that of the recently reported nuclear event in F01004-2237, which was interpreted as a TDE (Tadhunter et al. 2017). The narrow spectral features of the host and pre-flare photometric variability might instead indicate that these types of events represent a change in the accretion flow of AGN. OGLE17aaj showed a well-covered 60-day-long rise and a slow 200-day decline, followed by a plateau until day 300. This is unlike any TDE reported so far.
The discovery of OGLE17aaj, as well as other similar transients with high amplitudes in AGN, indicates that a new class of AGN-related phenomena exist. It may lead to new ways of investigating the close environments of SMBHs and the accretion flows through which they grow.
Acknowledgments
OGLE project is supported by the Polish NCN MAESTRO grant 2014/14/A/ST9/00121 to AU. This work is based on ESO programmes: 098.B-0768 (PI: Wyrzykowski), 0100.B-0503 (PI: Gromadzki), 188.D-3003, 191.D-0935 (PI: Smartt) and SALT Programme 2016-2-LSP-001. Polish participation in SALT is funded by grant no. MNiSW DIR/WK/2016/07. MG, AH, LW and KAR were supported by the Polish National Science Centre grant OPUS 2015/17/B/ST9/03167. PGJ, ZKR and FO acknowledge support from ERC Consolidator Grant 647208. MF is supported by a Royal Society – Science Foundation Ireland University Research Fellowship. KM acknowledges support from the STFC through an Ernest Rutherford Fellowship. Support for IA was provided by NASA through the Einstein Fellowship Program, grant PF6-170148. DB acknowledges support from the National Research Foundation of South Africa.
References
- Arcavi, I., Gal-Yam, A., Sullivan, M., et al. 2014, ApJ, 793, 38 [NASA ADS] [CrossRef] [Google Scholar]
- Assef, R. J., Kochanek, C. S., Brodwin, M., et al. 2010, ApJ, 713, 970 [NASA ADS] [CrossRef] [Google Scholar]
- Bajaja, E., Arnal, E. M., Larrarte, J. J., et al. 2005, A&A, 440, 767 [NASA ADS] [CrossRef] [EDP Sciences] [Google Scholar]
- Bentz, M. C., Peterson, B. M., Pogge, R. W., & Vestergaard, M. 2009, ApJ, 694, L166 [NASA ADS] [CrossRef] [Google Scholar]
- Berney, S., Koss, M., Trakhtenbrot, B., et al. 2015, MNRAS, 454, 3622 [NASA ADS] [CrossRef] [Google Scholar]
- Bianchi, L., Herald, J., Efremova, B., et al. 2011, Ap&SS, 335, 161 [NASA ADS] [CrossRef] [Google Scholar]
- Blagorodnova, N., Gezari, S., Hung, T., et al. 2017, ApJ, 844, 46 [NASA ADS] [CrossRef] [Google Scholar]
- Boller, T., Freyberg, M. J., Trümper, J., et al. 2016, A&A, 588, A103 [NASA ADS] [CrossRef] [EDP Sciences] [Google Scholar]
- Breeveld, A. A., Curran, P. A., Hoversten, E. A., et al. 2010, MNRAS, 406, 1687 [NASA ADS] [Google Scholar]
- Burrows, D. N., Hill, J. E., Nousek, J. A., et al. 2005, Space Sci. Rev., 120, 165 [NASA ADS] [CrossRef] [Google Scholar]
- Hurley-Walker, N., Callingham, J. R., Hancock, P. J., et al. 2017, MNRAS, 464, 1146 [NASA ADS] [CrossRef] [Google Scholar]
- Crawford, S. M., Still, M., Schellart, P., et al. 2010, Proc. SPIE, 7737, 773725 [Google Scholar]
- Cutri, R. M., Wright, E. L., Conrow, T., et al. 2013, VizieR Online Data Catalog: II/328 [Google Scholar]
- Gehrels, N., Chincarini, G., Giommi, P., et al. 2004, ApJ, 611, 1005 [NASA ADS] [CrossRef] [Google Scholar]
- Gezari, S., Chornock, R., Rest, A., et al. 2012, Nature, 485, 217 [NASA ADS] [CrossRef] [PubMed] [Google Scholar]
- Gromadzki, M., Hamanowicz, A., & Wyrzykowski, L. 2017, ATel, 9977 [Google Scholar]
- Guillochon, J., & Ramirez-Ruiz, E. 2015, ApJ, 809, 166 [NASA ADS] [CrossRef] [Google Scholar]
- Graham, M. J., Djorgovski, S. G., Drake, A. J., et al. 2017, MNRAS, 470, 4112 [NASA ADS] [CrossRef] [Google Scholar]
- Holoien, T. W.-S., Kochanek, C. S., Prieto, J. L., et al. 2016, MNRAS, 455, 2918 [NASA ADS] [CrossRef] [Google Scholar]
- Hung, T., Gezari, S., Jones, D. O., et al. 2016, ApJ, 833, 226 [NASA ADS] [CrossRef] [Google Scholar]
- Kalberla, P. M. W., Burton, W. B., Hartmann, D., et al. 2005, A&A, 440, 775 [NASA ADS] [CrossRef] [EDP Sciences] [Google Scholar]
- Klencki, J., Wyrzykowski, Ł., Kostrzewa-Rutkowska, Z., & Udalski, A. 2016, Acta Astron., 66, 15 [NASA ADS] [Google Scholar]
- Kozłowski, S. 2015, Acta Astron., 65, 251 [NASA ADS] [Google Scholar]
- LaMassa, S. M., Cales, S., Moran, E. C., et al. 2015, ApJ, 800, 144 [NASA ADS] [CrossRef] [Google Scholar]
- Lawrence, A., Bruce, A. G., MacLeod, C., et al. 2016, MNRAS, 463, 296 [NASA ADS] [CrossRef] [Google Scholar]
- Leloudas, G., Fraser, M., Stone, N. C., et al. 2016, Nat. Astron., 1, 0002 [NASA ADS] [CrossRef] [Google Scholar]
- MacLeod, C. L., Ross, N. P., Lawrence, A., et al. 2016, MNRAS, 457, 389 [NASA ADS] [CrossRef] [Google Scholar]
- Mattila, S., Pérez-Torres, M., Efstathiou, A., et al. 2018, Science, eaao4669 [CrossRef] [Google Scholar]
- Monet, D. G., Levine, S. E., Canzian, B., et al. 2003, AJ, 125, 984 [NASA ADS] [CrossRef] [Google Scholar]
- Murphy, T., Sadler, E. M., Ekers, R. D., et al. 2010, MNRAS, 402, 2403 [NASA ADS] [CrossRef] [Google Scholar]
- Peng, C. Y., Ho, L. C., Impey, C. D., & Rix, H.-W. 2010, AJ, 139, 2097 [NASA ADS] [CrossRef] [Google Scholar]
- Poole, T. S., Breeveld, A. A., Page, M. J., et al. 2008, MNRAS, 383, 627 [NASA ADS] [CrossRef] [Google Scholar]
- Rees, M. J. 1988, Nature, 333, 523 [NASA ADS] [CrossRef] [Google Scholar]
- Roming, P. W. A., Kennedy, T. E., Mason, K. O., et al. 2005, Space Sci. Rev., 120, 95 [NASA ADS] [CrossRef] [Google Scholar]
- Schlafly, E. F., & Finkbeiner, D. P. 2011, ApJ, 737, 103 [NASA ADS] [CrossRef] [Google Scholar]
- Shen, Y., Richards, G. T., Strauss, M. A., et al. 2011, ApJS, 194, 45 [NASA ADS] [CrossRef] [Google Scholar]
- Smartt, S. J., Valenti, S., Fraser, M., et al. 2015, A&A, 579, A40 [NASA ADS] [CrossRef] [EDP Sciences] [Google Scholar]
- Stanway, E. R., Levan, A. J., & Brown, G. C. 2017, ATel, 25 [Google Scholar]
- Stone, N. C., & Metzger, B. D. 2016, MNRAS, 455, 859 [NASA ADS] [CrossRef] [Google Scholar]
- Tadhunter, C., Spence, R., Rose, M., Mullaney, J., & Crowther, P. 2017, Nat. Astron., 1, 0061 [NASA ADS] [CrossRef] [Google Scholar]
- Trakhtenbrot, B., Arcavi, I., Ricci, C., et al. 2019, Nat. Astron., in press [Google Scholar]
- Udalski, A., Szymański, M. K., & Szymański, G. 2015, Acta Astron., 65, 1 [NASA ADS] [Google Scholar]
- Vanden Berk, D. E., Richards, G. T., Bauer, A., et al. 2001, AJ, 122, 549 [NASA ADS] [CrossRef] [Google Scholar]
- Wang, X.-Y., & Liu, R.-Y. 2016, Phys. Rev. D, 93, 083005 [NASA ADS] [CrossRef] [Google Scholar]
- Wright, E. L., Eisenhardt, P. R. M., Mainzer, A. K., et al. 2010, AJ, 140, 1868 [NASA ADS] [CrossRef] [Google Scholar]
- Wyrzykowski, Ł., Kostrzewa-Rutkowska, Z., Kozłowski, S., et al. 2014, Acta Astron., 64, 197 [NASA ADS] [Google Scholar]
- Wyrzykowski, Ł., Zieliński, M., Kostrzewa-Rutkowska, Z., et al. 2017, MNRAS, 465, L114 [NASA ADS] [CrossRef] [Google Scholar]
All Figures
|
Fig. 1. Upper panel: host-subtracted photometry of OGLE17aaj in the OGLE-IV I and V bands and the Swift UVW1 and UVW2 bands in absolute magnitudes as a function of days since maximum. Lower panel: temperature evolution derived from Swift ultraviolet data over the same period. |
| In the text | |
|
Fig. 2. Sequence of spectra obtained for OGLE17aaj. VLT observations are marked in black, those from the NTT in red, and SALT observations are shown in orange. The upper two spectra are of F01004-2237 (Tadhunter et al. 2017) and a typical TDE, ASASSN-14li (Holoien et al. 2016), for comparison. |
| In the text | |
|
Fig. 3. OGLE I-band host-subtracted flux measurement at the centre of the host galaxy before the transient, covering 2010–2016. The horizontal line shows the maximum flux level reached by OGLE17aaj in 2017. |
| In the text | |
Current usage metrics show cumulative count of Article Views (full-text article views including HTML views, PDF and ePub downloads, according to the available data) and Abstracts Views on Vision4Press platform.
Data correspond to usage on the plateform after 2015. The current usage metrics is available 48-96 hours after online publication and is updated daily on week days.
Initial download of the metrics may take a while.