Free Access
Fig. 2.
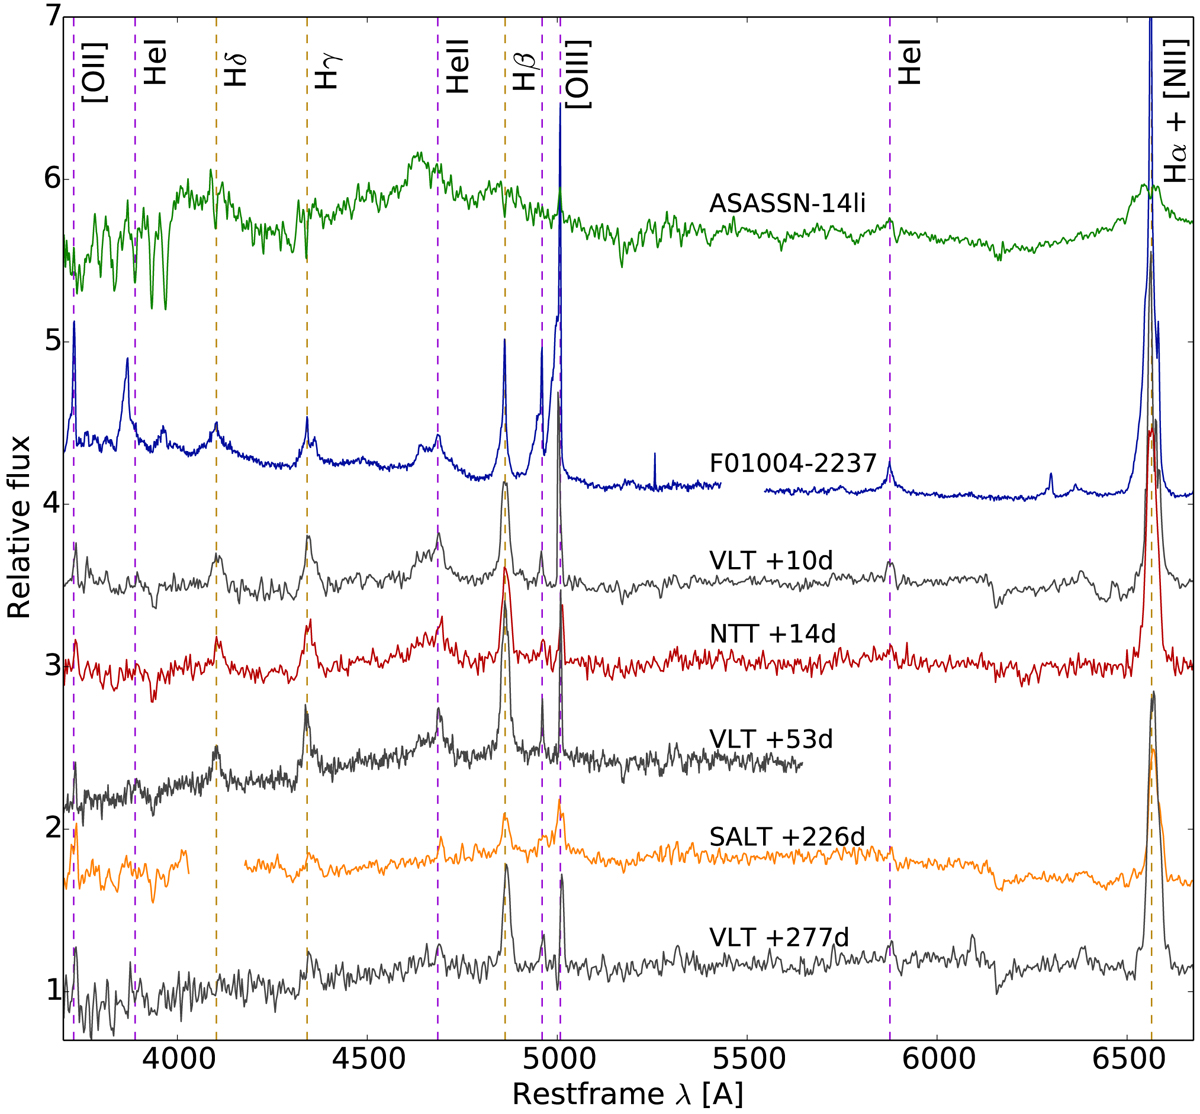
Sequence of spectra obtained for OGLE17aaj. VLT observations are marked in black, those from the NTT in red, and SALT observations are shown in orange. The upper two spectra are of F01004-2237 (Tadhunter et al. 2017) and a typical TDE, ASASSN-14li (Holoien et al. 2016), for comparison.
Current usage metrics show cumulative count of Article Views (full-text article views including HTML views, PDF and ePub downloads, according to the available data) and Abstracts Views on Vision4Press platform.
Data correspond to usage on the plateform after 2015. The current usage metrics is available 48-96 hours after online publication and is updated daily on week days.
Initial download of the metrics may take a while.