Free Access
Fig. 3.
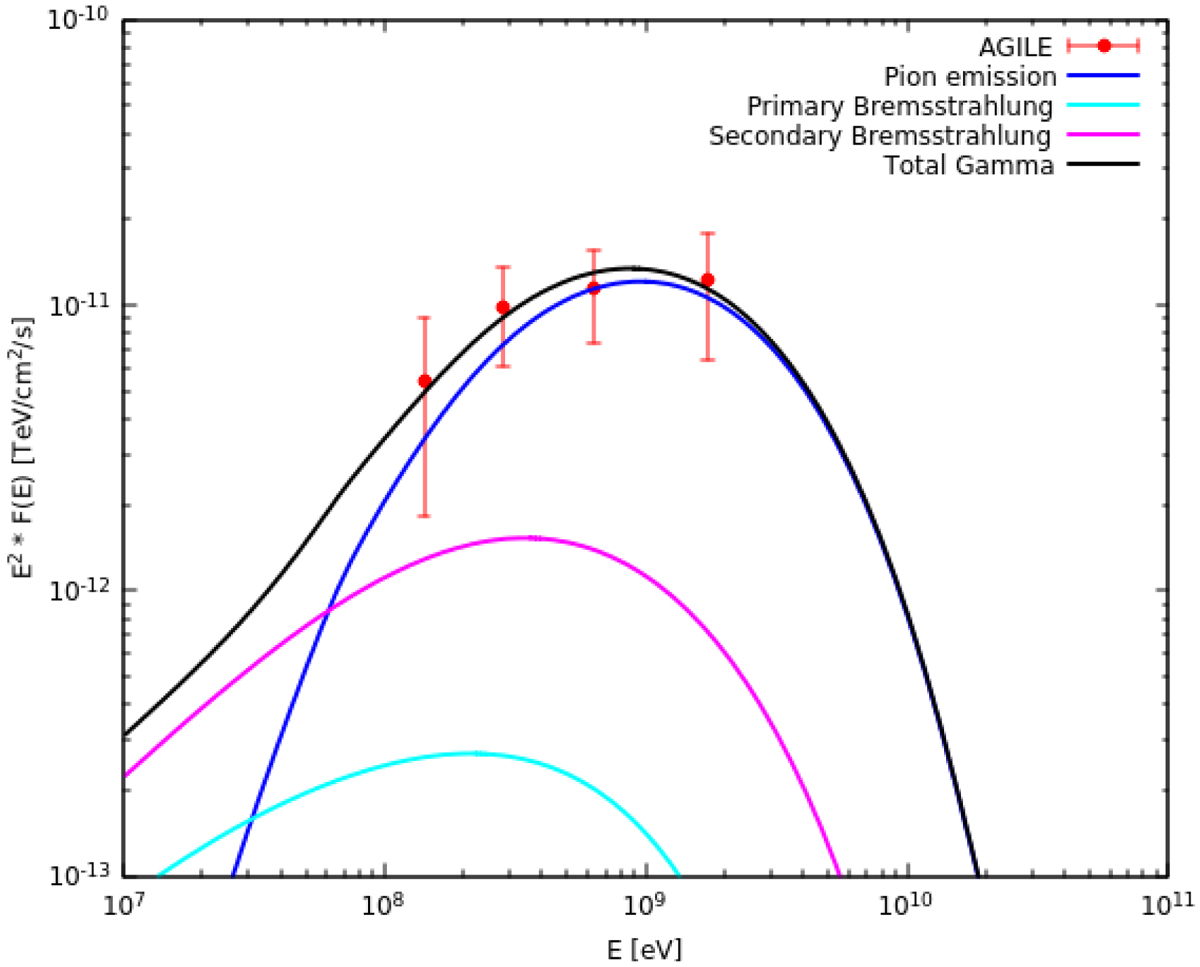
AGILE (red) γ-ray points plotted with γ-ray emission from pion decay (blue line), from primary Bremsstrahlung (cyan dashed line), from secondary Bremsstrahlung (magenta dashed line), and total emission (black line).
Current usage metrics show cumulative count of Article Views (full-text article views including HTML views, PDF and ePub downloads, according to the available data) and Abstracts Views on Vision4Press platform.
Data correspond to usage on the plateform after 2015. The current usage metrics is available 48-96 hours after online publication and is updated daily on week days.
Initial download of the metrics may take a while.