Free Access
Fig. A.1.
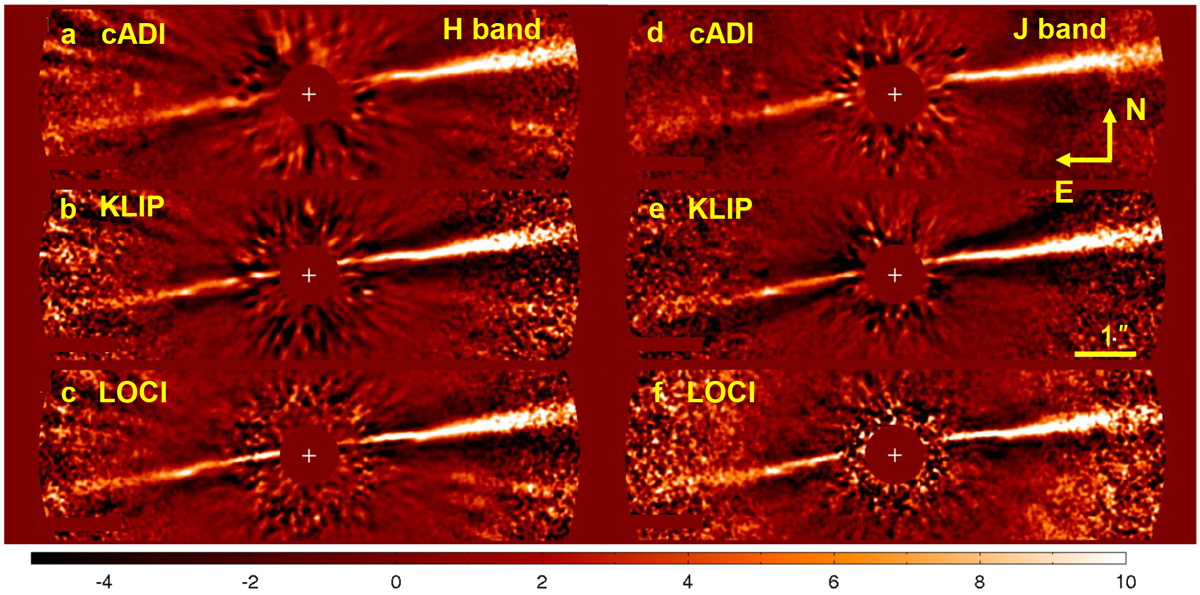
S/N map for different data-reduction techniques in the H band (left column) and in the J band (right column). The number of modes in KLIP reductions is 10. The star position is marked with a white cross.
Current usage metrics show cumulative count of Article Views (full-text article views including HTML views, PDF and ePub downloads, according to the available data) and Abstracts Views on Vision4Press platform.
Data correspond to usage on the plateform after 2015. The current usage metrics is available 48-96 hours after online publication and is updated daily on week days.
Initial download of the metrics may take a while.