| Issue |
A&A
Volume 622, February 2019
|
|
|---|---|---|
| Article Number | A175 | |
| Number of page(s) | 13 | |
| Section | Astrophysical processes | |
| DOI | https://doi.org/10.1051/0004-6361/201833319 | |
| Published online | 15 February 2019 | |
Non-thermal emission resulting from a supernova explosion inside an extragalactic jet
1
Instituto Argentino de Radioastronomía (IAR, CCT La Plata, CONICET; CICPBA), C.C.5, 1984 Villa Elisa, Buenos Aires, Argentina
e-mail: This email address is being protected from spambots. You need JavaScript enabled to view it.
2
Departament de Física Quàntica i Astrofísica, Institut de Ciències del Cosmos (ICC), Universitat de Barcelona (IEEC-UB), Martí i Franquès 1, 08028 Barcelona, Spain
Received:
28
April
2018
Accepted:
11
January
2019
Abstract
Context. Core-collapse supernovae are found in galaxies with ongoing star-formation. In a starburst galaxy hosting an active galactic nucleus with a relativistic jet, supernovae can take place inside the jet. The collision of the supernova ejecta with the jet flow is expected to lead to the formation of an interaction region, in which particles can be accelerated and produce high-energy emission.
Aims. We study the non-thermal radiation produced by electrons accelerated as a result of a supernova explosion inside the jet of an active galactic nucleus within a star-forming galaxy.
Methods. We first analyzed the dynamical evolution of the supernova ejecta impacted by the jet. Then, we explored the parameter space using simple prescriptions for the observed gamma-ray lightcurve. Finally, the synchrotron and the inverse Compton spectral energy distributions for two types of sources, a radio galaxy and a powerful blazar, are computed.
Results. For a radio galaxy, the interaction between a supernova and a jet of power ∼1043 − 1044 erg s−1 can produce apparent gamma-ray luminosities of ∼1042 − 1043 erg s−1, with an event duty cycle of supernova remnant interacting with the jet close to one for one galaxy. For a blazar with a powerful jet of ∼1046 erg s−1, the jet-supernova ejecta interaction could produce apparent gamma-ray luminosities of ∼1043 − 1044 erg s−1, but with a much lower duty cycle.
Conclusions. The interaction of supernovae with misaligned jets of moderate power can be relatively frequent, and can result in steady gamma-ray emission potentially detectable for sources in the local universe. For powerful blazars much farther away, the emission would be steady as well, and it might be detectable under very efficient acceleration, but the events would be rather infrequent.
Key words: radiation mechanisms: non-thermal / galaxies: active / galaxies: nuclei / galaxies: jets
© ESO 2019
1. Introduction
Active galactic nuclei (AGNs) are composed of a supermassive black hole accreting material from the central region of its galaxy host. In order for the black hole to be active, dust, gas, and matter must be available for accretion. One way to enhance accretion is through galaxy mergers (Stockton 1982). At the same time, galaxy interactions or mergers can stimulate nuclear star formation (Toomre & Toomre 1972).
Although galaxies hosting AGNs can be of different types, they tend to be massive galaxies (M > 1010 M⊙) with younger stellar populations than average (Kauffmann et al. 2003). Several studies have shown that luminous AGN hosts are likely to have higher star-formation rates (SFRs) than normal galaxies (e.g., Kauffmann et al. 2003; Shao et al. 2010); but it may also be the case for low or moderate luminosity AGNs, as suggested by Hickox et al. (2014), Gürkan et al. (2015). There is growing evidence supporting a close connection between nuclear starbursts and AGNs (e.g., Alexander & Hickox 2012). For example, AGN surveys show that the fraction of galaxies hosting AGNs is significantly lower for red galaxies (quiescent, composed mainly of old stars) than for blue (star-forming) galaxies (Wang et al. 2017).
Given the large amount of dust released in supernova (SN) explosions, these events were proposed as a possible mechanism to link starburst phenomena and AGN feedback (Ishibashi & Fabian 2016). Type Ia SNe are the only type of SNe found in old, elliptical galaxies. These are thermonuclear explosions associated either to an accreting white dwarf in a binary system, or to the merger of two white dwarfs (e.g., Maoz et al. 2014). On the other hand, in star-forming galaxies, a high rate of core-collapse SNe resulting from the explosions of massive, short-lived stars is expected (Kelly & Kirshner 2012).
Since high SFRs favor the occurrence of core-collapse SNe, one cannot neglect the possibility of a core-collapse SN taking place inside the jet of a radio-loud AGN. The resulting interaction, with the SN ejecta playing the role of a dynamical obstacle, may lead to detectable non-thermal radiation: When a jet interacts with an obstacle (e.g., clouds, stars with strong winds), a bow-shaped structure forms in the collision region of the two fluids. Particles can be accelerated up to relativistic energies in this region, and produce high-energy emission. The interaction between relativistic jets and obstacles has been explored in several works. Many of these works focused on studying the dynamical effects that the interaction can have on the jet (e.g., Komissarov 1994; Hubbard & Blackman 2006; Perucho et al. 2014, 2017); others were devoted to study the radiative effects, as gamma-ray flares (e.g., Barkov et al. 2010, 2012a; Bosch-Ramon et al. 2012; Banasiński et al. 2016), or steady high-energy emission (e.g., Araudo et al. 2010, 2013; Bednarek & Protheroe 1997; Bosch-Ramon 2015; Bednarek & Banasiński 2015; Wykes et al. 2015; de la Cita et al. 2016; Vieyro et al. 2017). Star-jet interactions were also proposed to explain the rapid-variability observed in some powerful blazars (e.g., Barkov et al. 2012b; Khangulyan et al. 2013; Aharonian et al. 2017).
In the present work, we have considered the dynamics and radiation of an AGN jet interacting with a SN. At first, the explosion is not halted by the jet presence until the SN ejecta becomes diluted enough. Then, when the SN ejecta reaches a size similar to the stagnation radius, that is, when the SN ejecta and jet ram pressures balance each other, the SN ejecta expansion is significantly slowed down by the jet impact in all directions but downstream the jet. From that point on, the evolution of the supernova remnant (SNR) is strongly affected by the jet impact. The possibility of supernova-AGN jet interaction has been previously explored for instance by Blandford & Koenigl (1979), who considered the prospect of such an interaction being the cause of the knots observed in the jet of the galaxy M87. In addition, Bednarek (1999) discussed the possibility of very efficient particle acceleration due to the interaction of an AGN jet with a SN shell. In that work, the SN was assumed to be within or close enough to the jet for the interaction to be significant, although the dynamical evolution of the interaction and the associated gamma-ray emission were not computed.
This article is organized as follows: in Sect. 2, the dynamical evolution of a SN ejecta accelerated by a jet is described using a simple model; this model is complemented in the Appendix with hydrodynamical simulations. In Sect. 3, we explore the jet parameter space, and study the outcomes of different scenarios using a simple prescription for the gamma-ray lightcurve. In Sect. 4 we compute the spectral energy distributions (SEDs) resulting from the electrons accelerated in the jet-SN ejecta interaction; we explore two cases: a nearby radio galaxy, and a more distant and powerful blazar. We discuss the adopted model and its results in Sect. 5, and close with the conclusions in Sect. 6.
2. Dynamical evolution
The dynamical evolution of an obstacle, for example, a cloud of gas, inside a jet has been extensively studied in several works. The impact of the jet causes a transfer of momentum and the consequent acceleration of the cloud. In addition, it produces a shock wave that propagates trough the cloud, compressing and heating it up. The heated material suffers a lateral expansion occurring approximately at the speed of sound. The cloud also forms an elongated tail in the downstream direction as a result of the pressure gradient caused by the impact of the jet. Kelvin–Helmholtz instabilities will start striping material from the cloud downstream. Rayleigh–Taylor instabilities can also develop at the cloud surface directly impacted by the jet, given the acceleration exerted by the jet on the cloud. Eventually, the instabilities should lead to the disruption of the cloud, mixing the latter with the jet flow.
The above description is rather simplified; in reality it is far more complex. Numerical studies show that for quite homogeneous clouds, the cross section can grow significantly before the cloud total disruption (Bosch-Ramon et al. 2012). This takes longer than the time it takes the shock to cross the cloud (e.g., Cooper et al. 2009; Pittard et al. 2010), and the (initial) acceleration timescale of the cloud (Bosch-Ramon et al. 2012). Radiative cooling, accompanied by subsequent cloud disruption, has been shown to significantly extend in time the obstacle role of a cloud impacted by a supersonic, non-relativistic wind (Cooper et al. 2009). On the other hand, relativistic simulations still show efficient expansion and acceleration of the cloud despite its disruption and radiative cooling (Perucho et al. 2017). The evolution can also be altered by additional factors, such as magnetic fields or thermal conduction, that are not taken into account in this work (e.g., Klein et al. 1994; Fragile et al. 2005).
For the acceleration of the cloud, we have based our study on Barkov et al. (2012a). In that work, the authors describe a model for the acceleration of a cloud, in the present case the SN ejecta, pushed by a magnetically-dominated jet. Here, we studied the dynamical evolution in the case of a purely hydrodynamical jet, since on the jet scales of interest most of the jet magnetic energy is expected to have been already transferred to kinetic energy.
We refer to the laboratory and the SN ejecta reference frame K and K′, respectively. For a relativistic jet with negligible thermal pressure, the momentum flux of the jet in K′ is:
 (1)
(1)
where  is the jet enthalpy,
  the adiabatic index (4/3 and 5/3 for a relativistic and a non-relativistic ideal, monoatomic adiabatic gas, respectively), and βrel = (βj − βc)/(1 − βjβc) the relative velocity between the jet and SN ejecta in c units, which have velocities βj and βc in K, respectively. The jet momentum flux in K, f, relates to f′ through:
 (2)
(2)
where Γc is the Lorentz factor of the cloud.
The SN ejecta momentum increases due to the acceleration caused by the jet in its direction of motion. The equation of motion is (Barkov et al. 2012a):
 (3)
(3)
which, combined with Eq. (2), results in:
 (4)
(4)
where  (
( for Γj ≫ 1) is the jet power (including rest mass).
The jet is assumed to be conical, that is, with a constant opening angle θ, where the radius of the jet is a function of the distance z to the black hole: rj(z)≈θ z. We adopt a jet Lorentz factor of Γj = 10 and an opening angle of θ = 1/Γj.
The time lasted by the event as seen by the observer relates to the time in the laboratory frame t as
 (5)
(5)
where i is the angle between the jet axis and the line of sight.
The impact of the jet, in addition to transferring kinetic energy, heats up the SN ejecta as well. The SN ejecta is in pressure balance with the shocked jet flow that is pushing, with the pressure at the contact region being ∼f′. Since initially the jet flow is strongly supersonic in K′, f′ is larger than the jet lateral total pressure, and the jet-SN ejecta pressure balance leads to the above mentioned fast SN ejecta expansion, fueled by the jet-transferred heat.
The expansion of the SN ejecta enhances the interaction with the jet, favoring the acceleration of the former, and also its disruption. As already noted, simulations show that the (deformed) SN ejecta expansion and acceleration can continue for some time (Bosch-Ramon et al. 2012; Perucho et al. 2017; see also the Appendix). If the SN ejecta achieves a relativistic regime, which is the case for a powerful jet, its expansion in the laboratory frame is slowed down: (i) in the jet direction, by the relatively small velocity difference between different parts of the SN ejecta; (ii) in the direction perpendicular to the jet, relativistic time dilation in the flow frame leads to a slow expansion. We note that the lateral pressure of the shocked jet fluid, which passes around the SN ejecta, may contribute to confine the SN ejecta, slowing its expansion down to some extent (not considered here but at the end of the expansion; see below). These effects combined allow the SN ejecta to keep some integrity even when close to total disruption, extending the time needed for fully mixing with the jet flow and the traveled distance inside the jet in the laboratory frame. For weak jets, the SN ejecta accelerates at a low rate, and it is expected to cover a longer distance inside the jet before its disruption (Khangulyan et al. 2013). These predictions are supported by results presented in the appendix, where we show the results of an axisymmetric, relativistic hydrodynamical simulation of an interaction between the SN ejecta and a relatively weak jet. Based on these results, and on the above discussion for the powerful jet case, we have assumed for simplicity here that most of the SN ejecta mass remains in causal contact with the jet contact surface, effectively evolving as a roughly spherical cloud, with its radius increasing as
 (6)
(6)
where R0 is the initial SN ejecta radius, and
 (7)
(7)
is the SN ejecta sound speed squared, with hc being the specific enthalpy of the SN ejecta, and Pc its pressure. In the present context, R0 is determined through balancing its pressure and f′. This condition can be written as
![Mathematical equation: $$ \begin{aligned} \left[P_{\rm c}=f^{\prime }\right]\,\sim \,\left[\frac{3E_0}{10 \pi R_0^3} = \frac{L_{\rm j}}{c \pi r_{\rm j}(z)^2}\right], \end{aligned} $$](/articles/aa/full_html/2019/02/aa33319-18/aa33319-18-eq12.gif) (8)
(8)
where E0 is the total energy of the SN ejecta, adopted as the standard isotropic SN luminosity of E0 = 1051 erg. For simplicity, we adopted a reference SN ejecta mass value of Mc = 10 M⊙. We note that, since βc ∼ 0 at the beginning of the interaction, we use f′=f in Eq. (8).
Applicability of the dynamical model. When the SN ejecta has expanded significantly, its pressure can become smaller than the jet lateral pressure, taken here one hundredth of f as a fiducial value. Its exact value does not have a strong impact on the results as long as the jet is highly supersonic in K. Once the SN ejecta pressure is equal to the jet lateral pressure, the SN ejecta evolves more smoothly with the jet flow. From that point on, we assumed that the jet energy and momentum transferred to the SN ejecta become small, and therefore neglect any further acceleration of particles.
When the SN ejecta covers the whole jet section, its expansion rate is assumed to be the same as that of the jet, i.e., rc ∼ rj, with the jet flow at the interaction location moving with the SN ejecta. This is a reasonable assumption to zeroth order, as long as the jet external medium is much denser than the jet itself, which is expected for a jet on the galactic disk scales, as the denser medium inertia encapsulates the jet shocked flow (see Sect. 5). An accurate account of this situation can show complex features in the jet and SN ejecta hydrodynamics; this requires a numerical study, and a detailed account of such a process is out of the scope of this work (see the appendix for a simulation with a simple gas model).
3. General study
3.1. Simplified model
The galaxy host is assumed to be a starburst with a high SFR (ṀSFR) and a disk geometry. We considered that the starburst has an IR luminosity of LIR = 1012 L⊙ (e.g., an ultraluminous infrared galaxy, ULIRG, Sanders et al. 1988). The stellar and IR fields are modeled as gray bodies with characteristic temperatures of Ts = 30 000 K and TIR = 200 K, respectively (Vieyro et al. 2017).
There are three important free parameters in the model, Lj, Γj, and i. Throughout this work, we consider the jet Lorentz factor to be constant; in particular, we adopt Γj = 10, which is a common value in AGNs (e.g., Jorstad et al. 2017). Moderate variations around this value do not affect significantly the results of the model for jets with modest power, but the effect would be important for powerful blazars (see Sect. 5.4). The parameter space of the jet luminosity and inclination can be studied adopting a simplified model of the apparent non-thermal luminosity. The limitations of this simplified model are discussed in Sect. 5.
We considered that the SN explosion takes place at a height z0 inside the jet. We fix z0 ∼ 50 pc, as these are roughly the scales at which it is more likely that a SN explosion will occur within the jet, for the adopted star-forming disk. For smaller z0, the jet volume is much smaller; for larger z0, in the disk periphery and beyond, star formation is suppressed.
Inside the jet, the shocked SN ejecta acceleration and evolution results in an evolution of the jet energy flux dissipated at the jet-SN ejecta interaction surface in K′. This dissipated energy flux of the jet can be taken as a proxy of the energy flux injected into non-thermal particles. The corresponding power injected into non-thermal particles at z, due to the jet-SN ejecta interaction, can be expressed in K′ as:
 (9)
(9)
where the constant ηNT is the fraction of jet energy that impacts the SN ejecta and is converted into non-thermal energy. We note that the rest-mass energy has been removed to derive  . A reference value of 0.1 has been adopted for ηNT in this work; high enough so significant radiation is predicted, but well below the upper-limit of 1 (see Sect. 5.5).
Only a fraction of the energy that is injected in non-thermal particles is channeled into radiation. This fraction is quantified with the radiative efficiency  , which in K′ can be estimated as
 (10)
(10)
where  accounts for the non-radiative losses in K′ (e.g., adiabatic losses and particle advection, of similar scale; see Vieyro et al. 2017), and
  for synchrotron and IC losses in K′. The emitted energy in K′ is, then,
  .
.
The intrinsic luminosity should be corrected by Doppler boosting. The IC and synchrotron lightcurves of the radiation as seen by the observer can be estimated as
 (11)
(11)
where δc is the Doppler boosting factor of the emitting flow:
 (12)
(12)
and tobs is related to z through Eq. (5). Equation (11) is valid as long as the accelerated particles follow an energy distribution similar to ∝E−2, meaning that the energy is equally distributed among different energy scales (see also Sect. 4).
We have focussed here on electrons (and positrons) as radiating particles, and synchrotron and IC as radiative processes, as they emit the most efficiently in the regions of interest. Previous works considered also hadronic emission close to or at the jet base (e.g., Barkov et al. 2010, 2012b).
We derived the magnetic field to compute synchrotron emission assuming that the total magnetic energy density is a fraction ζeq of the jet energy density. For a magnetic field predominantly perpendicular to the flow motion (e.g., toroidal), in K′ one obtains:
 (13)
(13)
An equipartition magnetic field, ζeq = 1, would imply in our convention that the jet energy density is equally divided between magnetic and particle energy density. Throughout the article we adopt ζeq = 10−2 (except when otherwise indicated), which results in a magnetic field 10 times below the equipartition value, as estimated in some extragalactic jets (Hardcastle 2011).
We consider as main target photons for IC interactions the infrared (IR) field associated with starburst galaxies (Vieyro et al. 2017), and compute the IC cooling rate using the full Klein–Nishina cross section (Khangulyan et al. 2014) and following the target treatment described in Dermer & Schlickeiser (1993).
To obtain the lightcurves of IC emission, we calculate  at a reference energy of
  , where
  is approximately at the maximum of the IC cross section in K′ for (quasi)head-on IC interactions, around the transition from the Thomson to the Klein–Nishina regime.
3.2. Results of the simplified model
In Fig. 1, we show the evolution of the SN ejecta Lorentz factor for blazar-like sources (i.e., i = 0°), for different values of jet power, Γj = 10 and z0 = 50 pc. The more powerful the jet, the shorter the time it takes for the SN ejecta to be accelerated to a higher Lorentz factor; it reaches a relativistic regime before covering the whole jet section only for the most powerful jets (Lj = 1046 − 1047 erg s−1). We recall that, for all the cases studied, ηNT = 0.1.
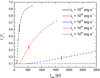 |
Fig. 1. Evolution of the SN ejecta Lorentz factor for different jet powers, for i = 0°. The vertical ticks mark the point where the SN ejecta crosses 1 kpc. The lines become dashed when the SN ejecta covers the whole jet section. |
In all cases, the SN ejecta expands and eventually covers the whole jet cross section. After this point, the dynamical model becomes less suitable to describe the evolution of the SN ejecta, hence in the figure we show this evolution phase using dashed lines (see Sect. 5 for a discussion of the validity of the model).
In Fig. 2, we show the approximated IC lightcurve in gamma rays, as seen by the observer, for Lj = 1043 − 1044 erg s−1 and different inclination angles. For intermediate inclinations, say i = 30°, the apparent luminosities are above 1042 and 1041 erg s−1, during an observed period of ∼104 and ∼105 yr, for Lj = 1044 and 1043 erg s−1, respectively. For completeness, the lightcurves show the SN ejecta propagating until it reaches z = 25 kpc. Nevertheless, the jet properties can change significantly on kpc scales (e.g., the jets may be already disrupted in weak, FRI-type jets), and our prescription for the SN ejecta evolution may be far from correct in those regions. Therefore, effective jet-SN ejecta interaction may be reliable up to z ≲ 10 kpc, and in fact results beyond z ∼ 1 kpc (indicated in the figures by vertical ticks) should be taken with caution.
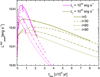 |
Fig. 2. Gamma-ray IC lightcurves computed for different inclination angles. As in Fig. 1, the vertical bars indicate the point where the SN reaches 1 kpc. |
For the most powerful jets, Lj ≥ 1045 erg s−1, synchrotron self-Compton (SSC) is the main mechanism of gamma-ray emission and for such process the semi-analytical approach described in Sect. 3.1 is no longer valid. For these jets, however, the approach is still valid for, and worth applying to, the synchrotron gamma-ray emission, which may reach ≳100 MeV as seen by the observer. The critical synchrotron energy can be estimated as
 (14)
(14)
where ς < 1, determines the particle acceleration rate Ė = ς q B c, and typically is not well constrained. For values of ς ≳ 1/δc, the critical energy can reach values of ∼100 MeV as seen by the observer. Figure 3 shows the synchrotron lightcurves for the powerful jets; we consider blazar-like sources, since high δc values are necessary to obtain photons of 100 MeV as seen by the observer. As in Fig. 2, the evolution is computed until z = 25 kpc, and the vertical bars mark the moment when the jet crosses 1 kpc. It can be seen that for these jets, the synchrotron radiation could dominate the gamma-ray emission in the Fermi energy range. As mentioned in Sect. 3.1, we have adopted ζeq = 10−2; since synchrotron losses are dominant for high energy electrons, the luminosities obtained at ∼100 MeV are similar for ζeq = 10−4 − 1.
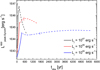 |
Fig. 3. Gamma-ray synchrotron lightcurves for powerful jets with i = 0°. As in Fig. 1, the solid-to-dashed transition indicates the moment the SN ejecta covers the jet section, and the vertical bars show the point where the SN crosses 1 kpc. |
In Fig. 4 we compare the power injected into non-thermal particles in the fluid frame,  , and corrected by Doppler boosting,
  , for Lj = 1044 erg s−1 (IC lightcurve) and Lj = 1046 erg s−1 (synchrotron lightcurve). In both cases, the rapid rise in the luminosity at the beginning of the event is caused by the increase of the flux injected into non-thermal particles (given by Eq. (9)). The SN ejecta reaches low Lorentz factors for the weakest jets (at least within 1 kpc, as can be seen in Fig. 1), thus Doppler boosting is not strong, and it only moderately increases the luminosity, as seen by the observer. For the strongest jets (≳1045 erg s−1), Doppler boosting is more relevant throughout the interaction. The higher peak luminosities and slower decay in
  are the result of Doppler boosting in all the cases.
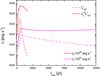 |
Fig. 4. Luminosity injected into non-thermal particles in K′, |


In Barkov et al. (2012a), the characteristic effective timescale of the interaction, that is the time during which the SN ejecta-jet interaction intensity is strong enough for effective particle acceleration to occur, can be roughly estimated as
 (15)
(15)
This expression is valid once the SN ejecta covers the complete jet section, which occurs early in all the cases studied here. This is in agreement with the results shown in Fig. 3 for powerful jets. For weaker jets, the slow acceleration of the SN ejecta renders Eq. (15) not suitable to estimate Δt.
4. Spectral energy distributions
As illustrative cases, the synchrotron and IC SEDs are computed at the time when the SN ejecta covers the jet section for two cases: a nearby radio galaxy with an intermediate jet power, and a powerful blazar at higher redshift. Both galaxies are considered to host a nuclear starburst as described in Sect. 3. We considered the radio galaxy to be located in the local universe at a distance d = 100 Mpc (z ≈ 0.026, for H0 = 70 km s−1 Mpc−1, ΩΛ = 0.7, and ΩM = 0.3), with a jet power Lj = 1044 erg s−1, and an inclination angle i = 60°. On the other hand, the more powerful blazar is considered to be located at z = 1 (equivalent to a luminosity distance of 6.6 Gpc), hosting a powerful jet with Lj = 1047 erg s−1 pointing toward the observer. Table 1 lists all the relevant parameter values of the model and the sources.
Main parameters of the model.
In order to compute the SEDs, we assume an injection rate of non-thermal particles in K′ following an energy distribution of the form:
 (16)
(16)
where α = 2 is taken as a fidutial value, typical for efficient accelerators, and characteristic of diffusive acceleration mechanisms. Functions Q much softer in energy would lead to gamma-ray emission much more difficult to detect, whereas harder Q would slightly increase the gamma-ray output. The value of  , determining the maximum particle energy, has been derived as in Vieyro et al. (2017). The total non-thermal luminosity injected is:
 (17)
(17)
For each z value, the transport equation in steady state is solved for an homogeneous emitter (one-zone), which has the following semi-analytical solution:
 (18)
(18)
where  accounts for the radiative and the non-radiative electron energy losses (Vieyro et al. 2017). We consider three different target fields for IC interactions: the radiation from the stars in the galaxy, IR photons associated with the starburst, and synchrotron emission (for SSC). The SSC calculations are correct as long as IC losses of synchrotron targets are not dominant. Although for powerful jets SSC is the main mechanism for gamma-ray emission (as shown in Fig. 5), it is not the dominant radiative loss mechanism.
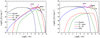 |
Fig. 5. Synchrotron and IC SEDs for the radio galaxy (left) and the blazar (right) cases, together with the sensitivities of different gamma-ray instruments (Fermi -pink-, presently operating Cherenkov telescopes -brown-, CTA -green-), at z = 51.3 and 55.3 pc, respectively. |
Figure 5 shows the computed SEDs obtained for the radio galaxy (left panel) and the blazar (right panel), together with the sensitivities of the Fermi observatory, MAGIC, as an example of current imaging air Cherenkov telescopes (IACTs), and the future Cherenkov Telescope Array (CTA). These SEDs correspond to the moment when the SN ejecta covers the whole jet section (see the solid-to-dashed line transition in Fig. 1). For the radio galaxy this occurs at z = 51.3 pc, when the SN ejecta has a Lorentz factor of only Γc = 1.0003, whereas for the blazar, the Lorentz factor is Γc = 1.43, at z = 55.3 pc. Although the peak in the lightcurves is predicted to be somewhat later in both cases (as seen, for example, in Fig. 3 for the blazar case), we compute the SEDs when rc equals rj because, up to this point, the semi-analytical treatment for the SN ejecta evolution is reasonably accurate. Nevertheless, the difference in the luminosity levels in the lightcurves between the moment when rc = rj, and their maxima, is only a factor of approximately two to three. Gamma-ray absorption effects are important above 10 TeV and have not been computed for the SEDs, but they are discussed in Sect. 4.2 below.
4.1. Main observational characteristics
The radio galaxy case yields the most optimistic predictions for detection, as its IC emission may be detectable by Fermi and current IACTs, for the adopted parameter values. In the blazar case, the synchrotron losses are dominant, causing a significant decrease in the gamma-ray IC luminosity. This effect, together with the large distances involved (say z ∼ 1), makes the jet-SN ejecta interactions difficult to detect from very powerful blazars with current instruments, but potentially detectable by CTA in the future. We note that a blazar of intermediate power, say Lj ∼ 1044 erg s−1, would resent a similar SED to the one of the radio galaxy (Fig. 5, left panel), with a higher normalization due to beaming effects. This case could be easily detected in the local universe, although this kind of source is rare with respect to sources of equal power with misaligned jets.
Very bright (or weak) radio sources may be evidence of the presence of high (/low) magnetic fields, and can be used to constrain the ζeq parameter. Low X-ray fluxes may also be an indicator of a very low magnetic fields. These comparison between bands may be difficult for weak radio and X-ray emission as it could be easily masked by other persistently emitting regions.
We can compare our predictions on different wavelengths with the steady emission detected from sources with similar characteristics to those of the two examples studied here. For instance, the well known quasar 3C 273 has a jet close to the line of sight with an estimated power of Lj ∼ 1046 erg s−1. The host galaxy is classified as an ULIRG, implying high SFR and IR luminosity. The gamma-ray luminosity observed by Fermi during a quiescent state in 2009 (Abdo et al. 2010) is L1 − 10 GeV ≳ 1045 erg s−1, comparable to the blazar case (right panel of Fig. 5). For the adopted value of ζeq = 10−2, the radio fluxes obtained are also similar to the typical observed fluxes from 3C 273, whereas in X-rays intrinsic jet emission, or even an accretion disk (as the one in 3C 273), could hide the radiation from a jet-SN ejecta interaction. In the radio galaxy case we take M87 as reference. This galaxy has a jet of Lj ∼ 1044 erg s−1, with an inclination angle of i = 20°. The detected radio luminosity is of L230 GHz ∼ 7 × 1040 erg s−1 (Doeleman et al. 2012), similar to the one obtained here. In the ∼GeV range we also obtained fluxes comparable to those observed in the steady state of M87. In X-rays, however, our predictions are greater than the fluxes of M87; this could be alleviated by reducing ζeq, which would affect also the predicted radio luminosity, or adopting a much lower value for ς (the acceleration rate efficiency).
The observer luminosities predicted in this work for jet-SN ejecta interactions are comparable to those already observed in steady sources, and particular spectral shapes cannot be predicted from a purely phenomenological particle acceleration model (one may say that typical acceleration spectra render typical radiation spectra). The magnetic field strength is also difficult to assess from first principles, adding more freedom to the spectral outcome of synchrotron and IC. In addition, the long timescales involved imply that the predicted lightcurves cannot be distinguished from intrinsic jet persistent emission. We can state, however, that SN ejecta are arguably the largest effective internal obstacles that AGN jets can encounter. Anything as massive, such as a compact molecular cloud, will be too diluted to fully enter the jet, whereas smaller objects such as stars and their winds can hardly cover a whole jet but in rare occasions: a large wind momentum rate plus a weak jet; lighter obstacles will produce also shorter events. Finally, for relatively nearby sources, radio VLBI could be used to resolve the obstacle, and discriminate different scenarios. For instance, Müller et al. (2014) found evidence of jet-obstacle interaction (probably with a star) in Centaurus A (see also Snios et al. 2019). A detailed case-by-case study, rich in observational information (not very common), is needed to ascertain whether a particular source persistent activity may be associated to a jet-SN ejecta interaction.
4.2. Gamma-ray absorption
Gamma-ray absorption cannot be neglected in the explored scenario in the IR and UV fields of the starburst. Figure 6 shows maps of gamma-ray opacity, associated to e± pair creation in the IR and OB star radiation fields, for the radio galaxy (left panel) and the blazar (right panel) cases. Absorption above ∼10 TeV is due to the IR field of the starburst. OB star emission affects mostly gamma rays of energies ≳100 GeV.
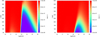 |
Fig. 6. Absorption maps in the IR and OB star radiation fields, for the radio galaxy (left panel) and the blazar (right panel). |
The IR absorption can be roughly estimated by τγγ ∼ 0.2σTnIRRd, where  . For the values adopted in Sect. 3.1, we obtain τγγ ∼ 80. This implies that all the emission at energies ≳10 TeV should be absorbed when the SN is within or close to the starburst disk, which is the case for the considered events around their maxima. This absorption would lead to pair creation in the jet surroundings, with a subsequent secondary synchrotron and IR-target IC emission. Given the complex structure of the jet-SN ejecta interaction region, it is difficult to assess the anisotropy level of the secondary radiation, as some pairs may get boosted if injected in the unshocked jet, while others would get isotropized in the surroundings. We speculate that, in the blazar scenario, this secondary emission may be minor with respect to the overall beamed emission, whereas for radio galaxies this contribution may be more important (see, e.g., Inoue 2011).
The UV field of OB stars, unlike the IR field, has a considerably lower impact. The optical depth takes now values of ≲10−2 for the radio galaxy, and even lower for the blazar case. This absorption should lead to secondary pairs emitting at ∼10 GeV energies, although their contribution would probably be minor.
5. Discussion
In this work, we studied the interaction of a relativistic jet with a SNR and its radiative consequences. First, we estimated in a simplified manner the observed gamma-ray luminosity evolution expected from this interaction. We then calculated, with more detail, the SED expected for a radio galaxy at d = 100 Mpc and a blazar at z = 1. We discuss below some of the assumptions adopted in this work.
5.1. Model comparison
In Fig. 7 we compare the luminosity evolution obtained using the simplified treatment given by Eq. (11) and the luminosity computed as described in Sect. 4. The plot corresponds to jets with Lj = 1043 − 1044 erg s−1, i = 60° and ζeq = 10−2. We have also included a comparison for a more powerful jet, of Lj = 1046 erg s−1 and i = 0°, for which we considered a well below equipartition magnetic field, B = 10−3Beq, in order for the external IC to dominate the emission over SSC. For the less powerful, non-blazar jets, the simple analysis predicts the emission rather accurately; for the powerful blazar, the simple prescription overestimates the luminosity by approximately an order of magnitude (as found already in Vieyro et al. 2017). The discrepancy of the synchrotron emission around ∼100 MeV predicted for blazar-sources by the two approaches (not shown in the figure) is higher than for the IC emission; during the peak of the event, however, we obtain the same difference of ∼0.1.
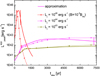 |
Fig. 7. Comparison between the gamma-ray lightcurves obtained with the simplified prescription (solid curve) and the more detailed treatment (dashed curve; stars indicate the points where the luminosity was computed). We consider i = 60° and ζeq = 10−2 for Lj = 1043 and 1044 erg s−1, and i = 0° and ζeq = 10−6 for Lj = 1046 erg s−1. The vertical ticks indicate the moment the SN reaches 1 kpc (for Lj = 1043 erg s−1 this takes place at tobs ∼ 1.8 × 10⁴ yr, hence it is not shown in the plot). |
5.2. Nature of the emitting flow
The assumptions that the emitter moves with the SN ejecta and has its size are in fact assumptions whose validity depends on the scenario. When the SN ejecta is slow, it efficiently acquires momentum, but not energy, while for a faster and diluted SN ejecta the energy transfer becomes more efficient (see Barkov et al. 2010, for a discussion of the energy transfer phases). Therefore, for a slow SN ejecta with a radius smaller than that of the jet, the shocked jet flow can be far more efficient at dissipating jet power in the form of non-thermal particles than within the SN ejecta. The emission from this quasi-stationary flow will be beamed, which would not be the case for an emitter moving with the SN ejecta. On the other hand, in the subrelativistic regime, the emitter is expected to be larger than the SN ejecta due to the extended oblique shock farther downstream (Bosch-Ramon 2015). Thus, the predicted radiation luminosity is affected by these unaccounted factors: beaming from a quasi-stationary flow, and a larger dissipation region.
When the SN ejecta becomes relativistic, the energy transferred from the jet to the shocked jet flow and to the SN ejecta becomes similar, and thus the latter may become a significant emitter in addition to the shocked jet flow. Both the shocked jet flow and the SN ejecta will still have different Doppler boosting patterns until Γc → Γj, point at which particle acceleration should become very weak or null.
Despite the qualitative differences, in the context of phenomenological modeling the model and most of the parameter values are basically the same regardless of the actual emitting flow: the shocked jet flow or the SN ejecta. The magnetic field values may otherwise differ in both regions.
In the scenario we studied, the radius of the SN ejecta tends to the jet radius. If the SN ejecta covers the whole jet section well before Γc → Γj, the shocked jet flow is still the most significant emitter, but it will move at the same velocity as the SN ejecta as long as the shocked jet flow is encapsulated by the external medium around the SN ejecta (see the following discussion and the Appendix).
5.3. A jet covered by the SN ejecta
As mentioned in Sect. 2 the shape of the SN ejecta impacted by the jet grows sidewards and forms an elongated tail along the jet direction. The ability of the SN ejecta to intercept jet energy is the most important factor in our study, and this depends exclusively on the size of the SN ejecta perpendicular to the jet. The lateral expansion of the SN ejecta near the surface impacted by the jet is expected to be fast. Here, for simplicity, we assumed that this expansion takes place at the sound speed, and that the density evolves as if the SN ejecta were spherical. SN ejecta disruption, plus some lateral pressure exerted by the shocked jet, makes this approximation less accurate. However, as discussed in the Appendix, the evolution of the main parameters obtained with the semi-analytical approach does not deviate significantly from the results of axisymmetric, relativistic hydrodynamical simulations1.
Expansion leads the SN ejecta to cover the whole jet section. At that point, we assume that the SN ejecta is confined by the jet walls and expands at the same rate as the conical jet. For a jet propagating in vacuum this approximation would be wrong, since nothing would prevent the SN ejecta to expand further. However, extragalactic jets usually propagate in media much denser than the jet itself, in particular when crossing their host galaxies. Thus, the dense external medium, heated and compressed by the SN ejecta when rc ≳ rj, strongly slows down its expansion with its large inertia. At most, the speed of the lateral expansion of the SN ejecta should be that of the Sedov-Taylor phase, with  . For most cases, after just ∼100 yr,
  already becomes lower than θβjc, meaning that the SN ejecta and the jet do eventually expand at roughly the same rate. Such a situation is likely to prevent the SN ejecta from expanding sidewards beyond the jet. If Γc → Γj, this situation may not have such a strong impact on the jet global structure, although the medium-SN ejecta interaction could slow down the latter. For slow or slowed-down SN ejecta, the braked jet should become disrupted at the z of the interaction with the SN ejecta, and shocked jet material flowing backwards may strongly affect jet propagation even far upstream, filling a lobe-like structure. The SN ejecta should also get disrupted by the jet impact, although at a slower rate, at least when the SN ejecta density is still higher than the jet density (e.g., Bosch-Ramon et al. 2012; see also the appendix).
Some of the effects discussed can be found in the complementary simulation presented in the Appendix. An accurate treatment of this scenario, combining detailed hydrodynamical simulations and precise radiation calculations, is left for future work.
5.4. Varying Γj and Mc
The jet Lorentz factor adopted in this work, Γj = 10, was taken as a reference value for illustrative purposes, but adopting Γj = 5 does not have a significant impact on the results for the weakest jets. We note that the velocity of the jet is likely non uniform through the section of the latter. The jet is expected to develop a shear layer as a transition region to the external medium. In addition, it has been proposed that the jet could consist of a light, ultra-relativistic, electron-positron pair plasma central spine, and a hadronic, heavier and slower outer layer, resulting from the Blandford–Znajek and Blandford-Payne processes (e.g., Xie et al. 2012; Ghisellini et al. 2005 and references therein). A non-uniform velocity profile with jet radius may not have a major impact in the explored scenario: the SN ejecta completely covers the jet before getting relativistic speeds, and thus the effect of any radial profile of the jet properties should tend to get smoothed out over the jet-SN ejecta contact surface. In any case, a non-homogeneous jet thrust and energy flux is likely to affect the SN ejecta evolution (e.g., enhancing instability growth), which is worth of a devoted future numerical study.
We also considered the impact of a less massive SN ejecta, adopting Mc = 1 M⊙. The main difference obtained in this case is the duration of the events, which become approximately ten times shorter than for Mc = 10 M⊙, for the same Lj-value; the lightcurve peak luminosities are, on the other hand, similar.
5.5. Impact of ηNT
An additional free parameter of the model is the acceleration efficiency ηNT. Here we have adopted a constant value of 0.1 throughout the paper. This parameter at present can only be constraint observationally, with a range as wide as ηNT = 0 − 1, and its value may also change as the properties of the jet-SN ejecta contact region evolve. Here, our results simply scale linearly with ηNT, and any change in the efficiency linearly affects the predicted luminosities. We note that additional acceleration sites may be present as well, as for instance: the more oblique region of the jet-SN ejecta shock present when rc ≪ rj and Γc ≪ Γj; or the region encompassing the SN-ejecta, the jet termination, and the external medium when rc ≳ rj. Here, we have considered only the jet-SN ejecta interaction region with section  .
.
5.6. Duty cycle
To determine how frequent the jet-SN ejecta interactions are in an AGN hosting a central disk-like starburst, one can estimate the SN rate expected in this type of galaxy. Stars with initial masses M > 8 M⊙ end their life as core-collapse SN (Matzner & McKee 1999); the upper limit on the progenitor mass is not clearly determined, but there is evidence that massive stars, with M ≳ 20 M⊙, collapse into a black hole, failing in produce a SN (Smartt 2015). We considered an initial mass function ϕ(m)∝m−α, where α = 0.3 for 0.01 ≤ m/M⊙ < 0.08, α = 1.8 for 0.1 ≤ m/M⊙ < 0.5, α = 2.7 for 0.5 ≤ m/M⊙ < 1, and α = 2.3 for m/M⊙ ≥ 1 (Kroupa 2001). Assuming a constant SFR, the core-collapse SN rate can be estimated according to (Mattila & Meikle 2001):
 (19)
(19)
For ṀSFR = 100 M⊙ yr−1, the SN rate in the starburst disk results in ∼70 SN per century.
For a starburst disk with radius Rd = 300 pc and total thickness hd = 100 pc, only ∼0.01% of these SNe will take place inside the jet with the adopted geometry. As discussed in Sect. 3.2, for a jet power Lj ∼ 1043 − 1044 erg s−1, a non-blazar source (say i ∼ 30°), and ηNT = 0.1, the interaction could result in a gamma-ray luminosity ≳1041 − 1042 erg s−1 for periods of ∼104 yr. This implies that for a single radio galaxy, the duty cycle of core-collapse SNe exploding within the jet should be approximately one. These gamma-ray luminosities may be detectable by Fermi and current IACTs, and in the future by CTA, for sources up to a few hundreds of Mpc, perhaps even further away for a more extreme choice of parameter values (e.g., ηNT → 1). In addition, provided the high duty cycle, several of these sources in the sky may be simultaneously producing gamma rays due to jet-SN ejecta interactions.
Regarding blazar type sources, the most powerful ones, say Lj ∼ 1047 erg s−1, may be detectable at z ∼ 1 in the future by CTA. However, the brief nature of such events, with a lightcurve peak duration ∼100 yr and a duty cycle per source of ∼1%, and the scarcity of objects, would imply a low frequency of occurrence.
As future work, we plan to study the statistics of starburst AGN with jet-SN ejecta interactions. In addition, Type Ia SNe can also occur in non star-forming galaxies, which are much more numerous than galaxies hosting starbursts. The interaction between a jet of an AGN and a Type Ia SN should also be studied, as many AGN are massive elliptical galaxies with jets. This study is also work under way.
6. Conclusions
In galaxies with high SFRs and jets of moderate power, the duty cycle of the interaction of the jet with SNe could be close to unity. This implies a rather steady gamma-ray luminosity that may be detectable, perhaps by Fermi and current IACTs, and more likely by the future instrument CTA, for sources in the local universe. Since there are several nearby galaxies with the characteristics assumed in this work, jet-SN ejecta emission could be responsible for some of the radio galaxies and relatively weak blazars detected as persistent gamma-ray sources. Blazars with powerful jets, not common in the local universe, might be still detectable at farther distances due to the expected higher luminosities, although the shorter duration of the events and scarce object numbers make their detection more unlikely.
We note here the complexities and uncertainties related to implementing an accurate numerical approach, which makes a semi-analytical treatment valuable for exploring several cases.
Acknowledgments
We want to thank an anonymous referee for his/her useful comments that helped to improve the manuscript. This work was supported by the Spanish Ministerio de Economía y Competitividad (MINECO/FEDER, UE) under grants AYA2013-47447-C3-1-P and AYA2016-76012-C3-1-P with partial support by the European Regional Development Fund (ERDF/FEDER), MDM-2014-0369 of ICCUB (Unidad de Excelencia “María de Maeztu”), and the Catalan DEC grant 2014 SGR 86. F.L.V acknowledges support from the Argentine Agency CONICET (PIP 2014-00338). N.T.A. acknowledges support from MINECO through FPU14/04887 grant.
References
- Abdo, A. A., Ackermann, M., Ajello, M., et al. 2010, ApJ, 714, L73 [NASA ADS] [CrossRef] [Google Scholar]
- Aharonian, F. A., Barkov, M. V., & Khangulyan, D. 2017, ApJ, 841, 61 [NASA ADS] [CrossRef] [Google Scholar]
- Alexander, D. M., & Hickox, R. C. 2012, New Astron. Rev., 56, 93 [NASA ADS] [CrossRef] [Google Scholar]
- Araudo, A. T., Bosch-Ramon, V., & Romero, G. E. 2010, A&A, 522, A97 [NASA ADS] [CrossRef] [EDP Sciences] [Google Scholar]
- Araudo, A. T., Bosch-Ramon, V., & Romero, G. E. 2013, MNRAS, 436, 3626 [NASA ADS] [CrossRef] [Google Scholar]
- Banasiński, P., Bednarek, W., & Sitarek, J. 2016, MNRAS, 463, L26 [NASA ADS] [CrossRef] [Google Scholar]
- Barkov, M. V., Aharonian, F. A., & Bosch-Ramon, V. 2010, ApJ, 724, 1517 [NASA ADS] [CrossRef] [Google Scholar]
- Barkov, M. V., Aharonian, F. A., Bogovalov, S. V., Kelner, S. R., & Khangulyan, D. 2012a, ApJ, 749, 119 [NASA ADS] [CrossRef] [Google Scholar]
- Barkov, M. V., Bosch-Ramon, V., & Aharonian, F. A. 2012b, ApJ, 755, 170 [NASA ADS] [CrossRef] [Google Scholar]
- Bednarek, W. ł. 1999, in Plasma Turbulence and Energetic Particles in Astrophysics, eds. M. Ostrowski, & R. Schlickeiser, 360 [Google Scholar]
- Bednarek, W., & Banasiński, P. 2015, ApJ, 807, 168 [NASA ADS] [CrossRef] [Google Scholar]
- Bednarek, W., & Protheroe, R. J. 1997, MNRAS, 287, L9 [NASA ADS] [CrossRef] [Google Scholar]
- Blandford, R. D., & Koenigl, A. 1979, Astrophys. Lett., 20, 15 [NASA ADS] [Google Scholar]
- Bosch-Ramon, V. 2015, A&A, 575, A109 [NASA ADS] [CrossRef] [EDP Sciences] [Google Scholar]
- Bosch-Ramon, V., Perucho, M., & Barkov, M. V. 2012, A&A, 539, A69 [NASA ADS] [CrossRef] [EDP Sciences] [Google Scholar]
- Cooper, J. L., Bicknell, G. V., Sutherland, R. S., & Bland-Hawthorn, J. 2009, ApJ, 703, 330 [NASA ADS] [CrossRef] [Google Scholar]
- de la Cita, V. M., Bosch-Ramon, V., Paredes-Fortuny, X., Khangulyan, D., & Perucho, M. 2016, A&A, 591, A15 [NASA ADS] [CrossRef] [EDP Sciences] [Google Scholar]
- de la Cita, V. M., del Palacio, S., Bosch-Ramon, V., et al. 2017, A&A, 604, A39 [NASA ADS] [CrossRef] [EDP Sciences] [Google Scholar]
- Dermer, C. D., & Schlickeiser, R. 1993, ApJ, 416, 458 [NASA ADS] [CrossRef] [Google Scholar]
- Doeleman, S. S., Fish, V. L., Schenck, D. E., et al. 2012, Science, 338, 355 [NASA ADS] [CrossRef] [PubMed] [Google Scholar]
- Donat, R., & Marquina, A. 1996, J. Comput. Phys., 125, 42 [NASA ADS] [CrossRef] [Google Scholar]
- Donat, R., Font, J. A., Ibáñez, J. M., & Marquina, A. 1998, J. Comput. Phys., 146, 58 [NASA ADS] [CrossRef] [Google Scholar]
- Fragile, P. C., Anninos, P., Gustafson, K., & Murray, S. D. 2005, ApJ, 619, 327 [NASA ADS] [CrossRef] [Google Scholar]
- Ghisellini, G., Tavecchio, F., & Chiaberge, M. 2005, A&A, 432, 401 [NASA ADS] [CrossRef] [EDP Sciences] [Google Scholar]
- Gürkan, G., Hardcastle, M. J., Jarvis, M. J., et al. 2015, MNRAS, 452, 3776 [NASA ADS] [CrossRef] [Google Scholar]
- Hardcastle, M. J. 2011, Science, 332, 429 [NASA ADS] [CrossRef] [Google Scholar]
- Hickox, R. C., Mullaney, J. R., Alexander, D. M., et al. 2014, ApJ, 782, 9 [NASA ADS] [CrossRef] [Google Scholar]
- Hubbard, A., & Blackman, E. G. 2006, MNRAS, 371, 1717 [NASA ADS] [CrossRef] [Google Scholar]
- Inoue, Y. 2011, ApJ, 728, 11 [NASA ADS] [CrossRef] [Google Scholar]
- Ishibashi, W., & Fabian, A. C. 2016, MNRAS, 463, 1291 [NASA ADS] [CrossRef] [EDP Sciences] [Google Scholar]
- Jorstad, S. G., Marscher, A. P., Morozova, D. A., et al. 2017, ApJ, 846, 98 [NASA ADS] [CrossRef] [Google Scholar]
- Kauffmann, G., Heckman, T. M., Tremonti, C., et al. 2003, MNRAS, 346, 1055 [Google Scholar]
- Kelly, P. L., & Kirshner, R. P. 2012, ApJ, 759, 107 [NASA ADS] [CrossRef] [Google Scholar]
- Khangulyan, D. V., Barkov, M. V., Bosch-Ramon, V., Aharonian, F. A., & Dorodnitsyn, A. V. 2013, ApJ, 774, 113 [NASA ADS] [CrossRef] [Google Scholar]
- Khangulyan, D., Aharonian, F. A., & Kelner, S. R. 2014, ApJ, 783, 100 [NASA ADS] [CrossRef] [Google Scholar]
- Klein, R. I., McKee, C. F., & Colella, P. 1994, ApJ, 420, 213 [NASA ADS] [CrossRef] [Google Scholar]
- Komissarov, S. S. 1994, MNRAS, 269, 394 [NASA ADS] [CrossRef] [Google Scholar]
- Kroupa, P. 2001, MNRAS, 322, 231 [NASA ADS] [CrossRef] [Google Scholar]
- Maoz, D., Mannucci, F., & Nelemans, G. 2014, ARA&A, 52, 107 [NASA ADS] [CrossRef] [Google Scholar]
- Mattila, S., & Meikle, W. P. S. 2001, MNRAS, 324, 325 [NASA ADS] [CrossRef] [Google Scholar]
- Matzner, C. D., & McKee, C. F. 1999, ApJ, 510, 379 [NASA ADS] [CrossRef] [Google Scholar]
- Mignone, A., & Bodo, G. 2005, MNRAS, 364, 126 [NASA ADS] [CrossRef] [Google Scholar]
- Müller, C., Kadler, M., Ojha, R., et al. 2014, A&A, 569, A115 [NASA ADS] [CrossRef] [EDP Sciences] [Google Scholar]
- Perucho, M., Martí, J. M., Laing, R. A., & Hardee, P. E. 2014, MNRAS, 441, 1488 [NASA ADS] [CrossRef] [Google Scholar]
- Perucho, M., Bosch-Ramon, V., & Barkov, M. V. 2017, A&A, 606, A40 [NASA ADS] [CrossRef] [EDP Sciences] [Google Scholar]
- Pittard, J. M., Hartquist, T. W., & Falle, S. A. E. G. 2010, MNRAS, 405, 821 [NASA ADS] [Google Scholar]
- Sanders, D. B., Soifer, B. T., Elias, J. H., et al. 1988, ApJ, 325, 74 [NASA ADS] [CrossRef] [Google Scholar]
- Shao, L., Lutz, D., Nordon, R., et al. 2010, A&A, 518, L26 [NASA ADS] [CrossRef] [EDP Sciences] [Google Scholar]
- Smartt, S. J. 2015, PASA, 32, e016 [NASA ADS] [CrossRef] [Google Scholar]
- Snios, B., Wykes, S., Nulsen, P. E. J., et al. 2019, ApJ, 871, 248 [NASA ADS] [CrossRef] [Google Scholar]
- Stockton, A. 1982, ApJ, 257, 33 [NASA ADS] [CrossRef] [Google Scholar]
- Toomre, A., & Toomre, J. 1972, ApJ, 178, 623 [NASA ADS] [CrossRef] [Google Scholar]
- Vieyro, F. L., Torres-Albà, N., & Bosch-Ramon, V. 2017, A&A, 604, A57 [NASA ADS] [CrossRef] [EDP Sciences] [Google Scholar]
- Wang, T., Elbaz, D., Alexander, D. M., et al. 2017, A&A, 601, A63 [NASA ADS] [CrossRef] [EDP Sciences] [Google Scholar]
- Wykes, S., Hardcastle, M. J., Karakas, A. I., & Vink, J. S. 2015, MNRAS, 447, 1001 [NASA ADS] [CrossRef] [Google Scholar]
- Xie, W., Lei, W.-H., Zou, Y.-C., et al. 2012, Res. Astron. Astrophys., 12, 817 [NASA ADS] [CrossRef] [Google Scholar]
Appendix A: Two-dimensional hydrodynamical simulations
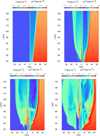 |
Fig. A.1. Combined color maps of a SN material pressure (left) and density (right) at different times: beginning of the interaction (top left), t = 592.6 yr (top right), t = 1188.1 yr (bottom left), and t = 1848.9 yr (bottom right). |
To quantify the precision of the semi-analytic model used to describe the evolution of a SN ejecta accelerated by the jet (see Sect. 2), we have performed axisymmetric, relativistic hydrodynamical (RHD) simulations in two dimensions of the interaction between a jet and a spherical cloud. We have considered a jet of negligible thermal pressure (1% of the jet ram pressure), Lj = 1045 erg s−1, and Γj = 10, and a uniform cloud at rest of 10 M⊙, initial radius Rc = 1.25 × 1018 cm (12.5 cells), and in pressure balance with the jet ram pressure (see Sect. 2). At the considered interaction location, the magnetic field was assumed to be dynamically negligible. The code that solved the RHD equations was the same as in de la Cita et al. (2017): third order in space (Mignone & Bodo 2005); second order in time; and using the Marquina flux formula (Donat & Marquina 1996; Donat et al. 1998). The adiabatic index of the gas was fixed to 4/3, corresponding to an ideal, monoatomic relativistic gas.
The grid adopted consisted of a uniform grid with 150 cells between  and
and  cm in the r-direction, and 300 cells between
  and
and  cm in the z-direction. An extended grid was added with 150 cells in the r-direction, from
  and
and  cm, and with 200 cells in the z-direction, from
  and
and  cm. The resolution was chosen such that no significant differences could be seen in the hydrodynamical results when increasing the resolution.
Inflow conditions (the jet) were imposed at the bottom of the grid, reflection at the axis, and outflow in the remaining grid boundaries. On the scales of the grid, for simplicity we approximated the jet streamlines as radial, and added a smooth but thin shear layer transiting from the jet properties to the external medium properties (radial velocity of 108 cm s−1, number density ≈1 cm−3, pressure equal to the jet thermal pressure) at θ ≈ 1/Γj.
Figure A.1 shows combined maps of pressure (left) and density (right) at different times, showing the beginning of the interaction (top left), and three intermediate stages: t = 592.6 yr (top right), t = 1188.1 yr (bottom left), and t = 1848.9 yr (bottom right). The plots show some of the effects discussed in Sects. 2 and 3, namely:
-
The SN ejecta completely covers the jet cross section from an early time;
-
Despite disruption, the cloud evolves roughly as a coherent structure (see also the figures shown below) until it has moved significantly further downstream;
-
The cloud does not expand much beyond the jet original radius before its disruption;
-
The jet begins to accelerate the SN material after ∼1000 yr (similar to what is shown in Fig. 1 for the jet with Lj = 1045 erg s−1), although in fact the simulation acceleration time is a few times longer.
To better illustrate the similarities between the semi-analytical treatment and the numerical simulations, in Fig. A.2 we show the comparison between the evolution of the main parameters of the cloud derived using both approaches. In the left panel we show the evolution of the cloud Lorentz factor; the acceleration of the cloud is reasonably reproduced by the treatment presented in Sect. 2, although, as mentioned above, the acceleration time obtained from the simulation is longer, favoring detectability (the duty cycle discussed in Sect. 5.6 is a conservative estimate if the acceleration time is longer). In the right panel, we have plotted the evolution of the mass-averaged cylindrical radius of the cloud. This parameter differs somewhat from the spherical semi-analytical case, but the differences are small in the long run, and with the jet still being effectively fully covered by the SN ejecta, which means that our approximation should be accurate enough at this stage. A generalization of the simulation to include other cases, and the computation of the radiative outcome, are left for future work.
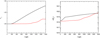 |
Fig. A.2. Comparison between the cloud evolution obtained using the semi-analytical approach (black lines) and the average values evolution obtained in the numerical simulations (red lines) for the Lorentz factor (left), and mass-averaged cylindrical radius (right). The time shown in these plots is in the laboratory frame. |
All Tables
All Figures
|
Fig. 1. Evolution of the SN ejecta Lorentz factor for different jet powers, for i = 0°. The vertical ticks mark the point where the SN ejecta crosses 1 kpc. The lines become dashed when the SN ejecta covers the whole jet section. |
| In the text | |
|
Fig. 2. Gamma-ray IC lightcurves computed for different inclination angles. As in Fig. 1, the vertical bars indicate the point where the SN reaches 1 kpc. |
| In the text | |
|
Fig. 3. Gamma-ray synchrotron lightcurves for powerful jets with i = 0°. As in Fig. 1, the solid-to-dashed transition indicates the moment the SN ejecta covers the jet section, and the vertical bars show the point where the SN crosses 1 kpc. |
| In the text | |
|
Fig. 4. Luminosity injected into non-thermal particles in K′, |
| In the text | |
|
Fig. 5. Synchrotron and IC SEDs for the radio galaxy (left) and the blazar (right) cases, together with the sensitivities of different gamma-ray instruments (Fermi -pink-, presently operating Cherenkov telescopes -brown-, CTA -green-), at z = 51.3 and 55.3 pc, respectively. |
| In the text | |
|
Fig. 6. Absorption maps in the IR and OB star radiation fields, for the radio galaxy (left panel) and the blazar (right panel). |
| In the text | |
|
Fig. 7. Comparison between the gamma-ray lightcurves obtained with the simplified prescription (solid curve) and the more detailed treatment (dashed curve; stars indicate the points where the luminosity was computed). We consider i = 60° and ζeq = 10−2 for Lj = 1043 and 1044 erg s−1, and i = 0° and ζeq = 10−6 for Lj = 1046 erg s−1. The vertical ticks indicate the moment the SN reaches 1 kpc (for Lj = 1043 erg s−1 this takes place at tobs ∼ 1.8 × 10⁴ yr, hence it is not shown in the plot). |
| In the text | |
|
Fig. A.1. Combined color maps of a SN material pressure (left) and density (right) at different times: beginning of the interaction (top left), t = 592.6 yr (top right), t = 1188.1 yr (bottom left), and t = 1848.9 yr (bottom right). |
| In the text | |
|
Fig. A.2. Comparison between the cloud evolution obtained using the semi-analytical approach (black lines) and the average values evolution obtained in the numerical simulations (red lines) for the Lorentz factor (left), and mass-averaged cylindrical radius (right). The time shown in these plots is in the laboratory frame. |
| In the text | |
Current usage metrics show cumulative count of Article Views (full-text article views including HTML views, PDF and ePub downloads, according to the available data) and Abstracts Views on Vision4Press platform.
Data correspond to usage on the plateform after 2015. The current usage metrics is available 48-96 hours after online publication and is updated daily on week days.
Initial download of the metrics may take a while.