Fig. 7.
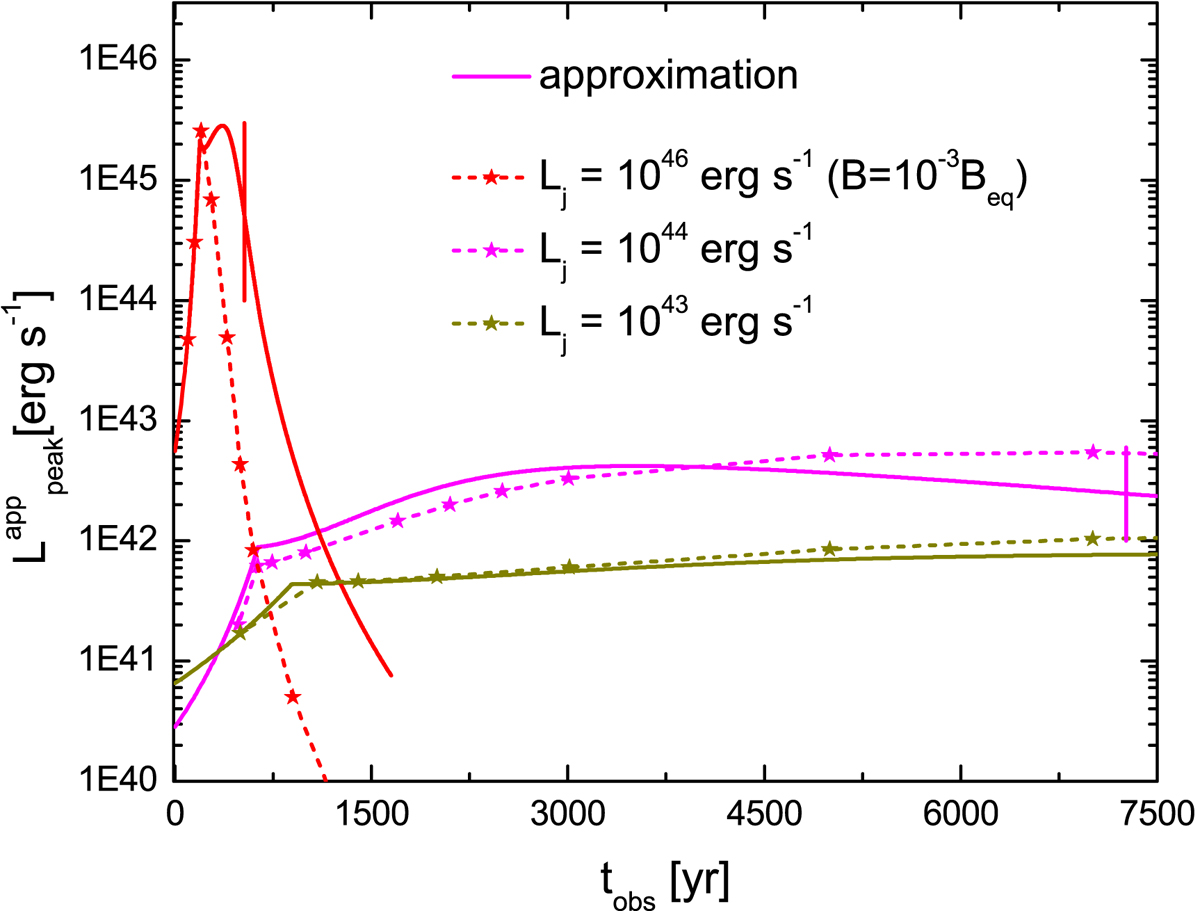
Comparison between the gamma-ray lightcurves obtained with the simplified prescription (solid curve) and the more detailed treatment (dashed curve; stars indicate the points where the luminosity was computed). We consider i = 60° and ζeq = 10−2 for Lj = 1043 and 1044 erg s−1, and i = 0° and ζeq = 10−6 for Lj = 1046 erg s−1. The vertical ticks indicate the moment the SN reaches 1 kpc (for Lj = 1043 erg s−1 this takes place at tobs ∼ 1.8 × 10⁴ yr, hence it is not shown in the plot).
Current usage metrics show cumulative count of Article Views (full-text article views including HTML views, PDF and ePub downloads, according to the available data) and Abstracts Views on Vision4Press platform.
Data correspond to usage on the plateform after 2015. The current usage metrics is available 48-96 hours after online publication and is updated daily on week days.
Initial download of the metrics may take a while.