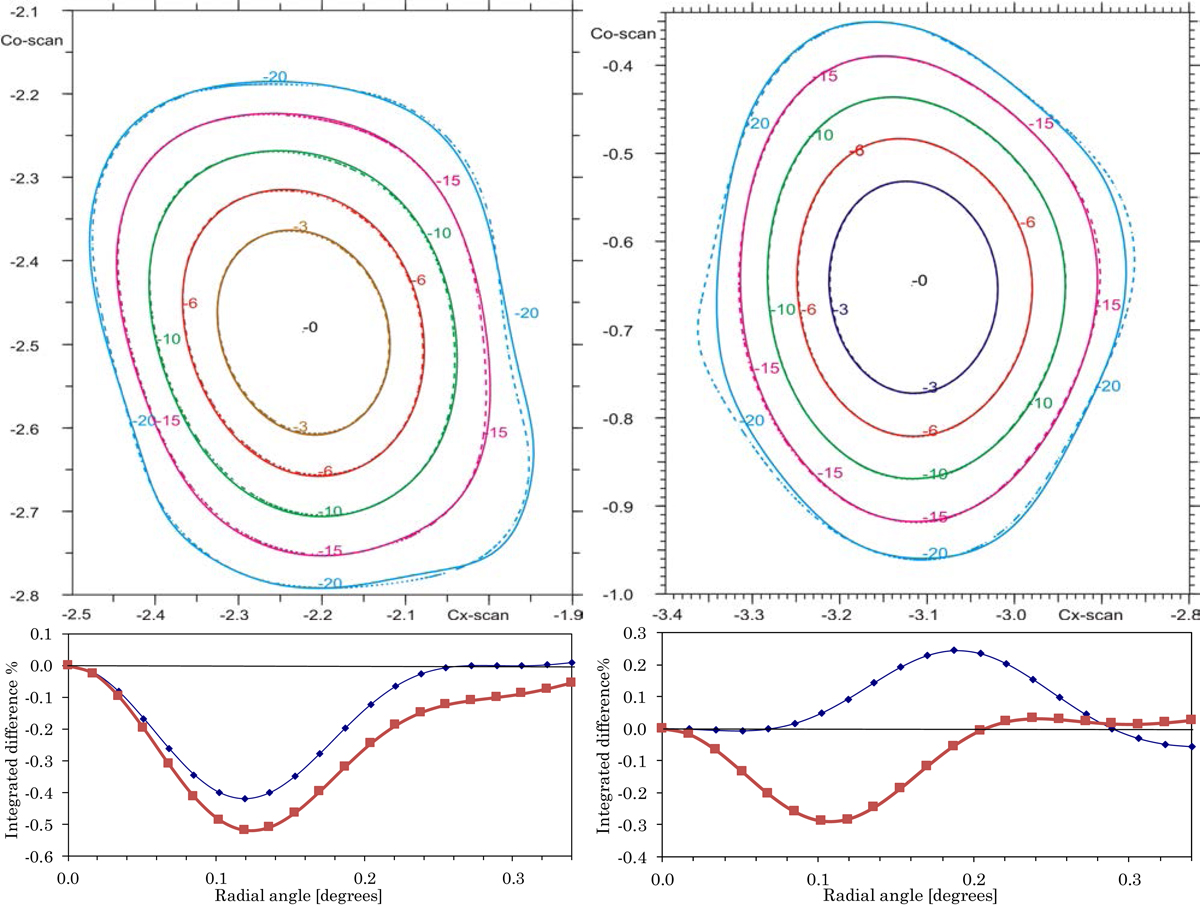
Fig. 16.
Download original image
Top panels: comparison of measured patterns (full line) to the corresponding LFI-only best-fit retrieved patterns (dashed line), for two individual detectors at 70 GHz: on the left is an example of a poor fit (high variance δ), 18S; and on the right a good fit (low variance), 20S. Bottom panels: difference in power between the above patterns, integrated up to a given radial angle, as a function of that angle; these plots are useful to identify where the major differences occur. We also show the equivalent curves (in red) for the RFFM pattern.
Current usage metrics show cumulative count of Article Views (full-text article views including HTML views, PDF and ePub downloads, according to the available data) and Abstracts Views on Vision4Press platform.
Data correspond to usage on the plateform after 2015. The current usage metrics is available 48-96 hours after online publication and is updated daily on week days.
Initial download of the metrics may take a while.