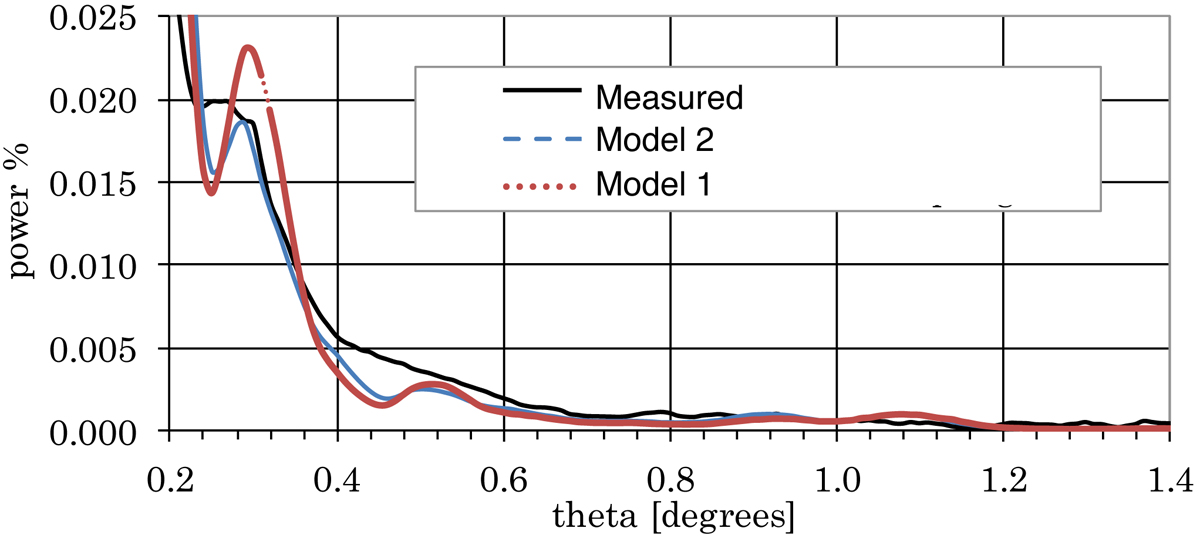
Fig. 10.
Download original image
Comparison of the two retrieved models (Model 1 and 2, see Table 2) against the measurements. The plot shows the difference in power between the measured Jupiter map (solid black line) and the two models, integrated in 0°̣01 radial bins. The measured pattern is normalized such that the total power within the region θ< 1°̣4 is equal to that in the model pattern; in addition an offset is added to account for its noise floor. Use of a mask covering the areas affected by residual time response effects has a negligible effect.
Current usage metrics show cumulative count of Article Views (full-text article views including HTML views, PDF and ePub downloads, according to the available data) and Abstracts Views on Vision4Press platform.
Data correspond to usage on the plateform after 2015. The current usage metrics is available 48-96 hours after online publication and is updated daily on week days.
Initial download of the metrics may take a while.