Fig. 6.
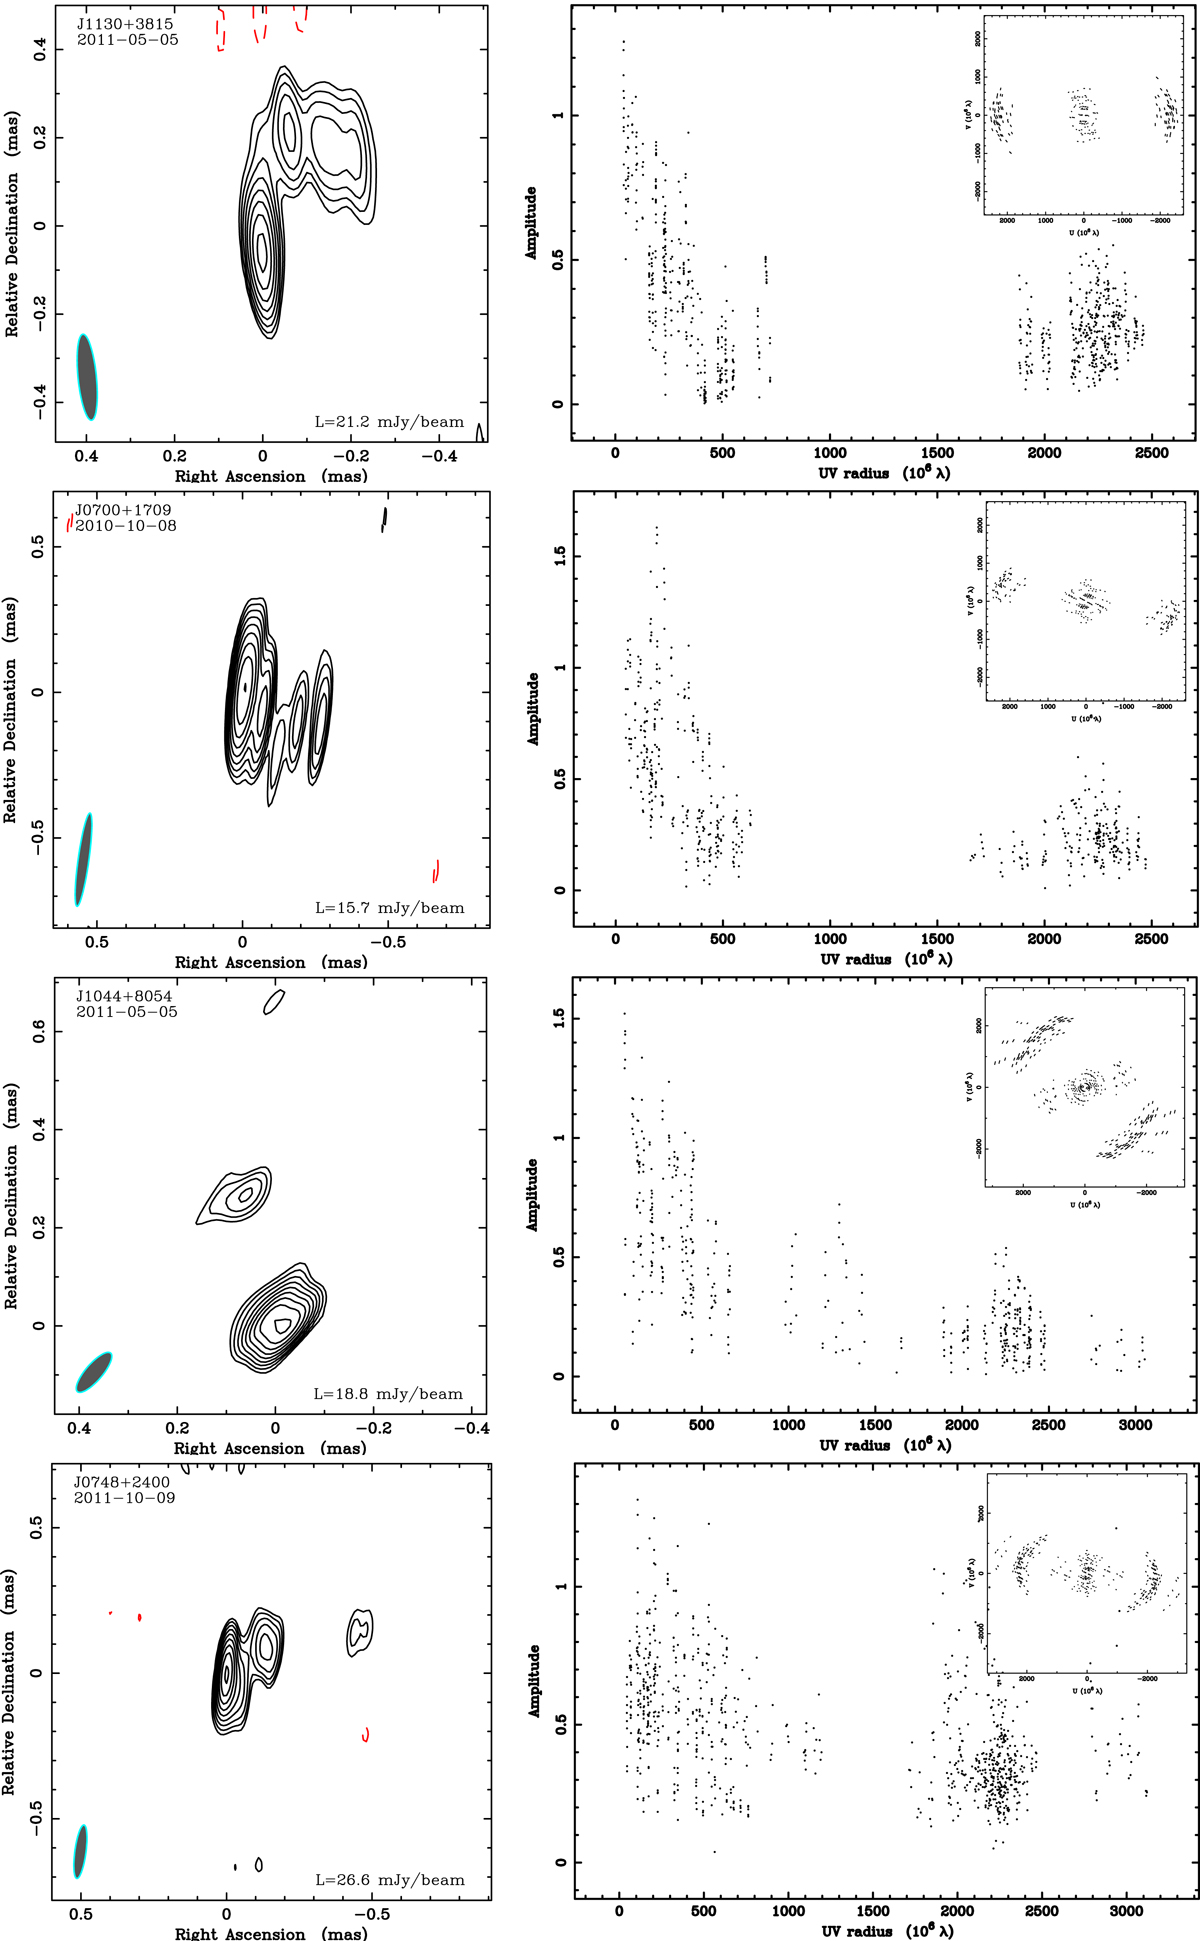
GMVA maps of J1130+3815, J0700+1709, J1044+8054, and J0748+2400 (left panel), shown together with the respective radial amplitude distributions (right panel) and uv-coverages (inset in the right panel) of the respective visibility datasets. The contouring of images is made at ![]() levels, with σrms representing the off-source rms noise in the residual image. The lowest contour in the maps, L = 21.2 mJy beam−1, 15.8 mJy beam−1, 18.8 mJy beam−1, and 26.6 mJy beam−1, respectively. A total of 174 contour maps of 162 unique sources imaged at 3 mm in this survey are available in Appendix A.
levels, with σrms representing the off-source rms noise in the residual image. The lowest contour in the maps, L = 21.2 mJy beam−1, 15.8 mJy beam−1, 18.8 mJy beam−1, and 26.6 mJy beam−1, respectively. A total of 174 contour maps of 162 unique sources imaged at 3 mm in this survey are available in Appendix A.
Current usage metrics show cumulative count of Article Views (full-text article views including HTML views, PDF and ePub downloads, according to the available data) and Abstracts Views on Vision4Press platform.
Data correspond to usage on the plateform after 2015. The current usage metrics is available 48-96 hours after online publication and is updated daily on week days.
Initial download of the metrics may take a while.