Fig. 5.
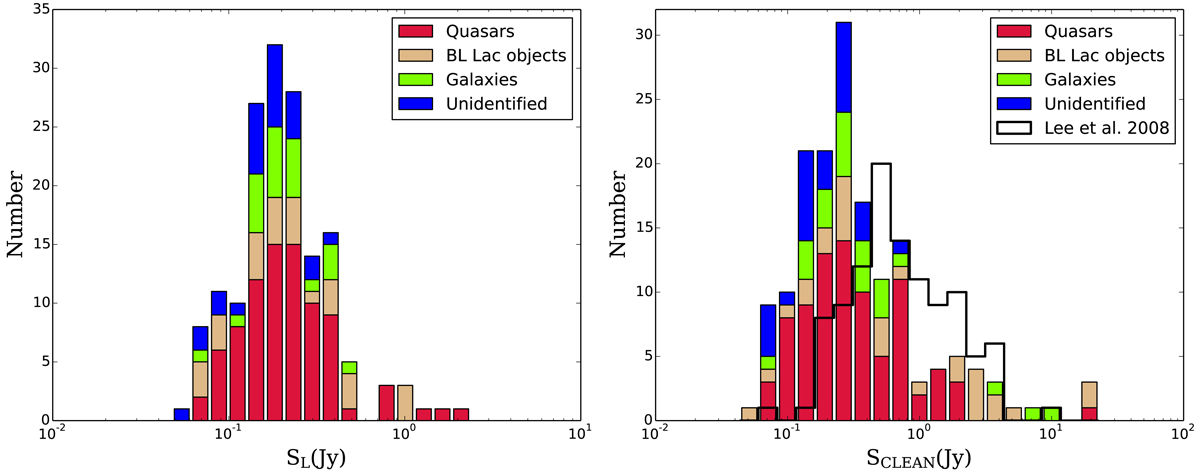
Distribution of the correlated flux densities corresponding to the longest baselines, SL (left) and the total clean image flux density, SCLEAN of the survey targets broken down according to different host galaxy types (right). The distribution of SCLEAN for the sources in this survey is also compared with the respective distribution for the sources from the sample of Lee et al. (2008) on the right panel.
Current usage metrics show cumulative count of Article Views (full-text article views including HTML views, PDF and ePub downloads, according to the available data) and Abstracts Views on Vision4Press platform.
Data correspond to usage on the plateform after 2015. The current usage metrics is available 48-96 hours after online publication and is updated daily on week days.
Initial download of the metrics may take a while.