Fig. 12.
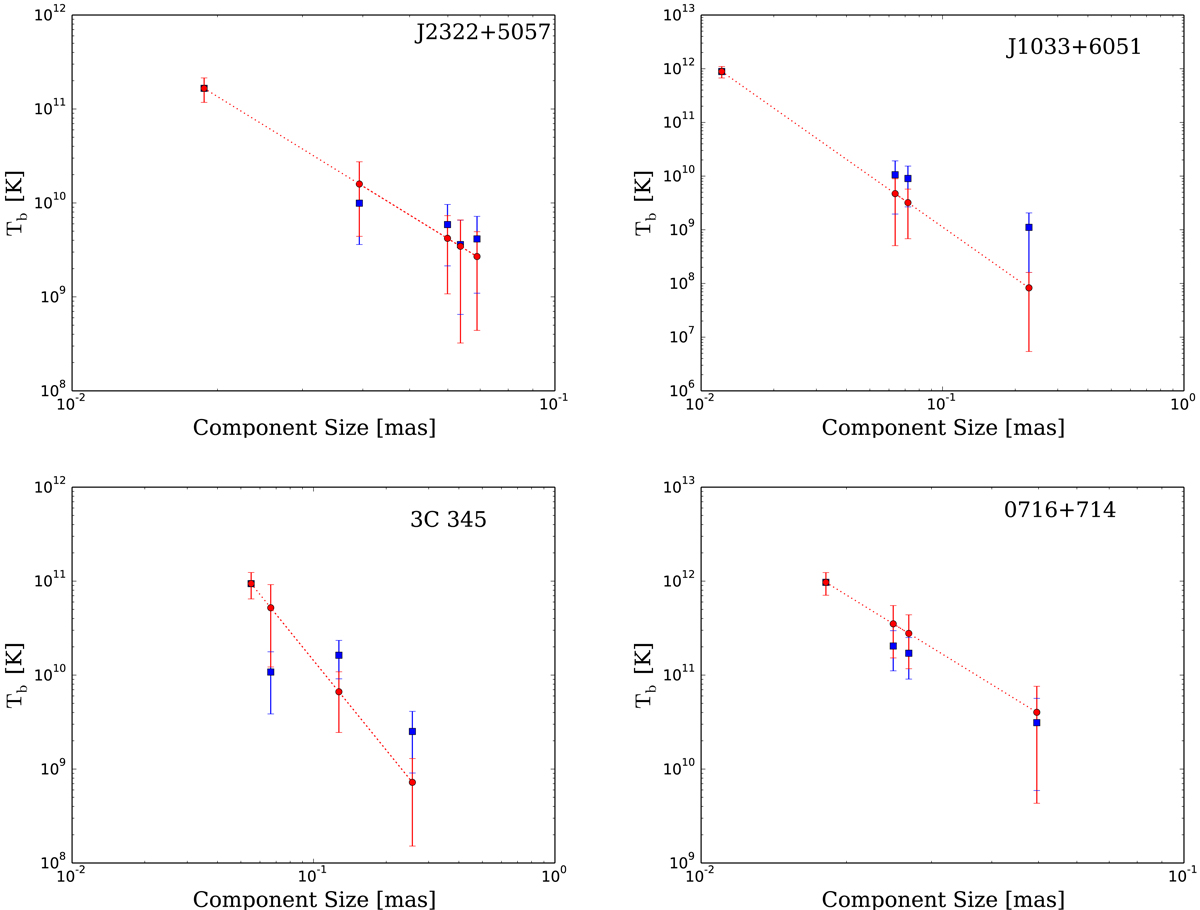
Changes of the brightness temperature as a funcion of jet width for four sources – J2322+5037, J1033+6051, 3C 345, and 0716+714 from this survey. Blue squares denote the measured Tb from this survey. The red circles connected with a dotted line represent theoretically expected Tb under the assumption of adiabatic jet expansion. The initial brightness temperature in each jet is assumed to be the same as that measured in the VLBI core.
Current usage metrics show cumulative count of Article Views (full-text article views including HTML views, PDF and ePub downloads, according to the available data) and Abstracts Views on Vision4Press platform.
Data correspond to usage on the plateform after 2015. The current usage metrics is available 48-96 hours after online publication and is updated daily on week days.
Initial download of the metrics may take a while.