Fig. 11.
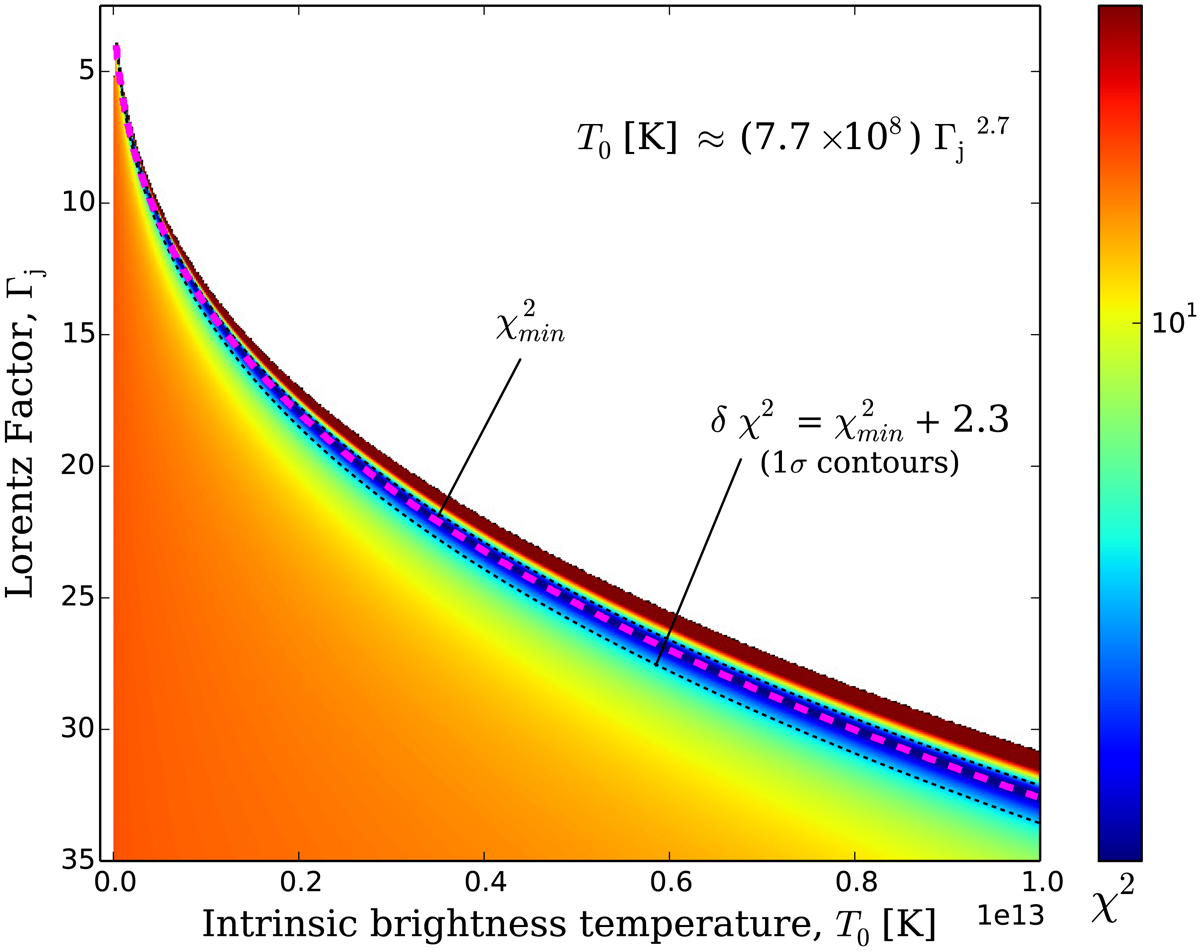
Two-dimensional χ2 distribution plot in the Γj – T0 space, calculated for the brightness temperatures measured in the VLBI cores. The blank area shows the ranges of the parameter space disallowed by the observed distribution. The distribution of the χ2 values indicates a (Γj–T0) correlation, with ![]() , thus precluding a simultaneous fit for Γj and T0.
, thus precluding a simultaneous fit for Γj and T0.
Current usage metrics show cumulative count of Article Views (full-text article views including HTML views, PDF and ePub downloads, according to the available data) and Abstracts Views on Vision4Press platform.
Data correspond to usage on the plateform after 2015. The current usage metrics is available 48-96 hours after online publication and is updated daily on week days.
Initial download of the metrics may take a while.