Fig. 4
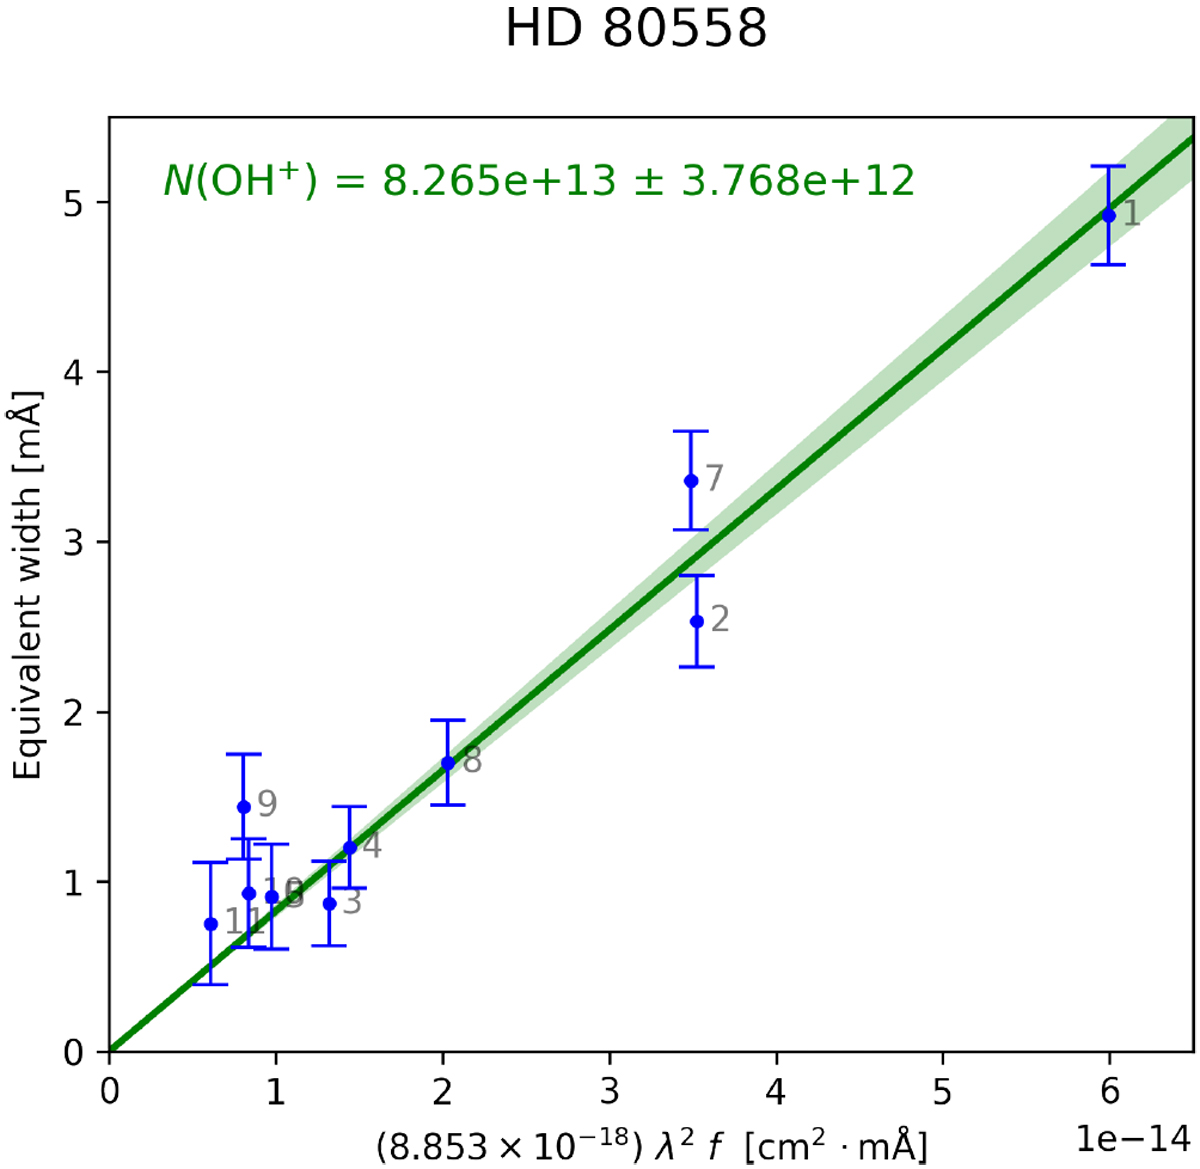
OH+ column density (shown here for HD 80558) derived from the slope of the line through points, plotting the equivalent width values as function of the transition wavelength and the oscillator strength, using Eq. (2). The line through the points is a linear fit weighted to the uncertainty of Wλ which yields a slope of (8.3 ± 0.4) × 1013 cm−2. Data points are marked according to the corresponding label for the OH+ line (Table 3; see Fig. C.1 for the plots of the other targets.)
Current usage metrics show cumulative count of Article Views (full-text article views including HTML views, PDF and ePub downloads, according to the available data) and Abstracts Views on Vision4Press platform.
Data correspond to usage on the plateform after 2015. The current usage metrics is available 48-96 hours after online publication and is updated daily on week days.
Initial download of the metrics may take a while.