Fig. 3
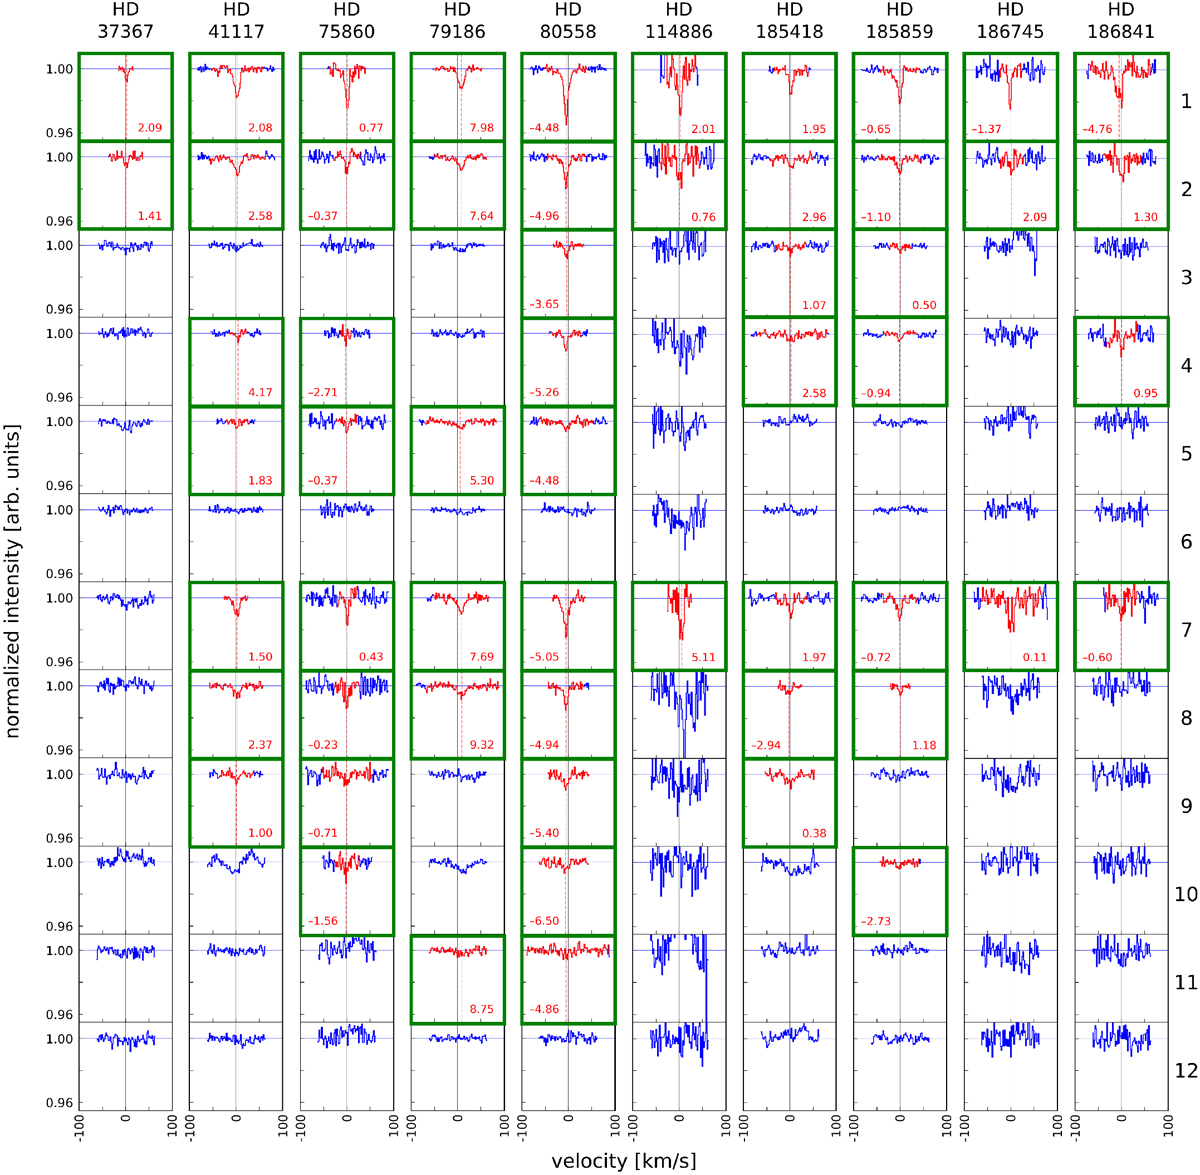
OH+ absorption lines observed (enclosed in green boxes) for each of the ten stellar targets. Every row of boxes is labeled on the right side according to the line labeling in Table 3. The solid vertical gray line in each box denotes the zero-point velocity set by the Na I UV transition, while the broken vertical red line denotes the center of the fitted profile. The inset of numbers indicates the velocity difference in km s−1 of the OH+ line from the rest frame of Na I UV. The red-highlighted trace in the spectrum is the region where the fitted Voigt profile is integrated. The y-scaling is uniform to emphasize the relative strengths of each of the lines in one target and among the rest. The relative S/N can also be directly compared.
Current usage metrics show cumulative count of Article Views (full-text article views including HTML views, PDF and ePub downloads, according to the available data) and Abstracts Views on Vision4Press platform.
Data correspond to usage on the plateform after 2015. The current usage metrics is available 48-96 hours after online publication and is updated daily on week days.
Initial download of the metrics may take a while.