Fig. 6.
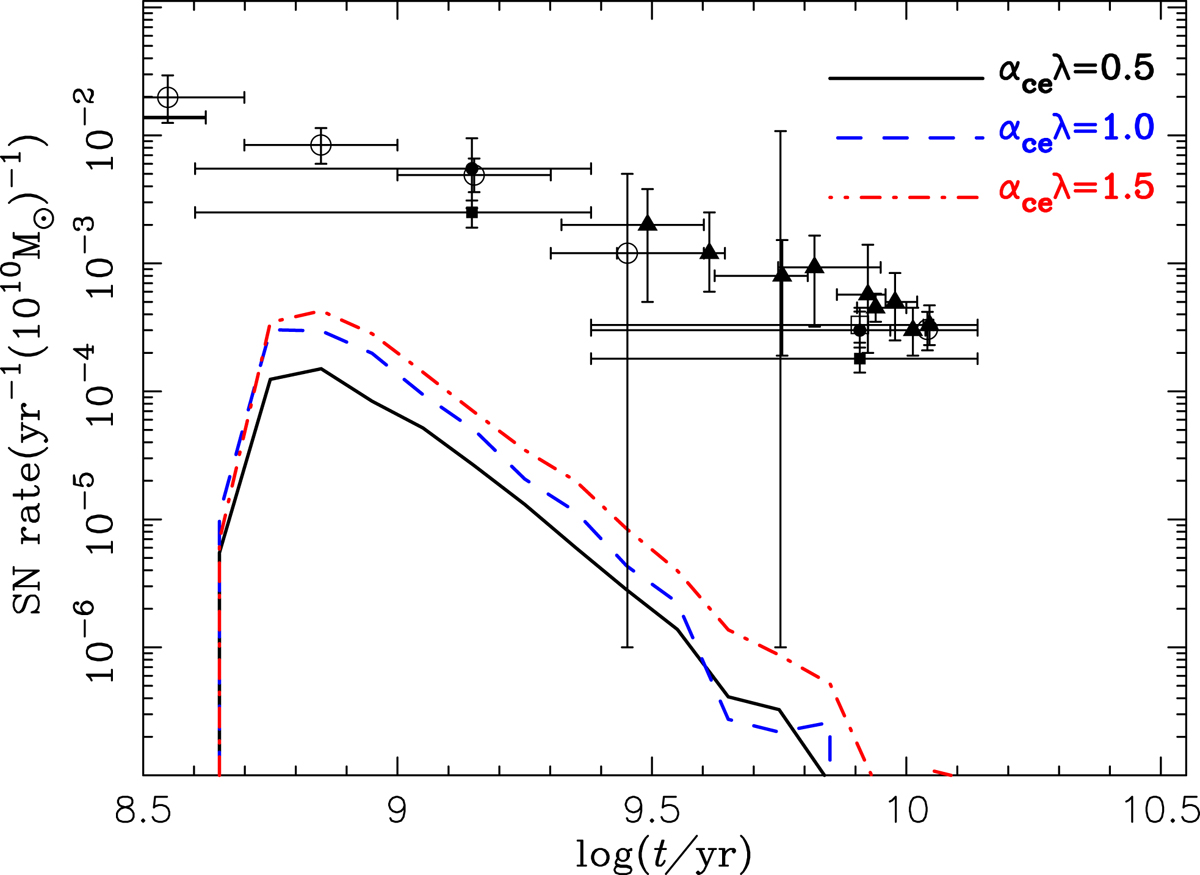
Delay time distributions of SNe Ia from the symbiotic channel, in which a star burst of 1010 M⊙ in stars is adopted. The open circles are from Totani et al. (2008), and the filled triangles, the filled circles, the filled squares, and the open square represent, respectively, observed results from Maoz et al. (2010, 2011, 2012) and Graur & Maoz (2013), all of which have been rescaled by Maoz & Graur (2017).
Current usage metrics show cumulative count of Article Views (full-text article views including HTML views, PDF and ePub downloads, according to the available data) and Abstracts Views on Vision4Press platform.
Data correspond to usage on the plateform after 2015. The current usage metrics is available 48-96 hours after online publication and is updated daily on week days.
Initial download of the metrics may take a while.