Fig. 1.
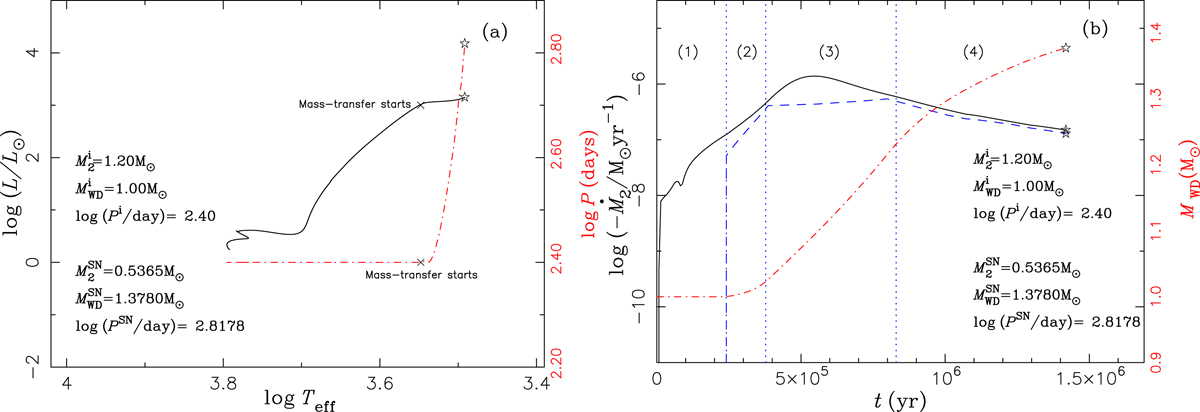
A typical binary evolution for producing SN Ia via the symbiotic channel. In panela, the solid curve represents the evolutionary track of the mass donor in the Hertzsprung–Russell diagram, and the dash-dotted curve shows the evolution of the orbital periods. The crosses in this panel represent the positions where mass transfer starts. In panelb, the evolution of Ṁ2, ṀWD, and MWD as a function of time are shown as solid, dashed, and dash-dotted curves, respectively. The position of t = 0 corresponds to the moment when the RG fills its Roche-lobe. The mass-transfer process can be divided into four phases: (1) the strong H-shell flash phase; (2) the stable H-shell burning or the weak H-shell flash phase; (3) the optically thick wind phase; (4) the stable H-shell burning or the weak H-shell flash phase. The asterisks in both panels indicate the position where an SN Ia explosion occurs.
Current usage metrics show cumulative count of Article Views (full-text article views including HTML views, PDF and ePub downloads, according to the available data) and Abstracts Views on Vision4Press platform.
Data correspond to usage on the plateform after 2015. The current usage metrics is available 48-96 hours after online publication and is updated daily on week days.
Initial download of the metrics may take a while.