Fig. 7.
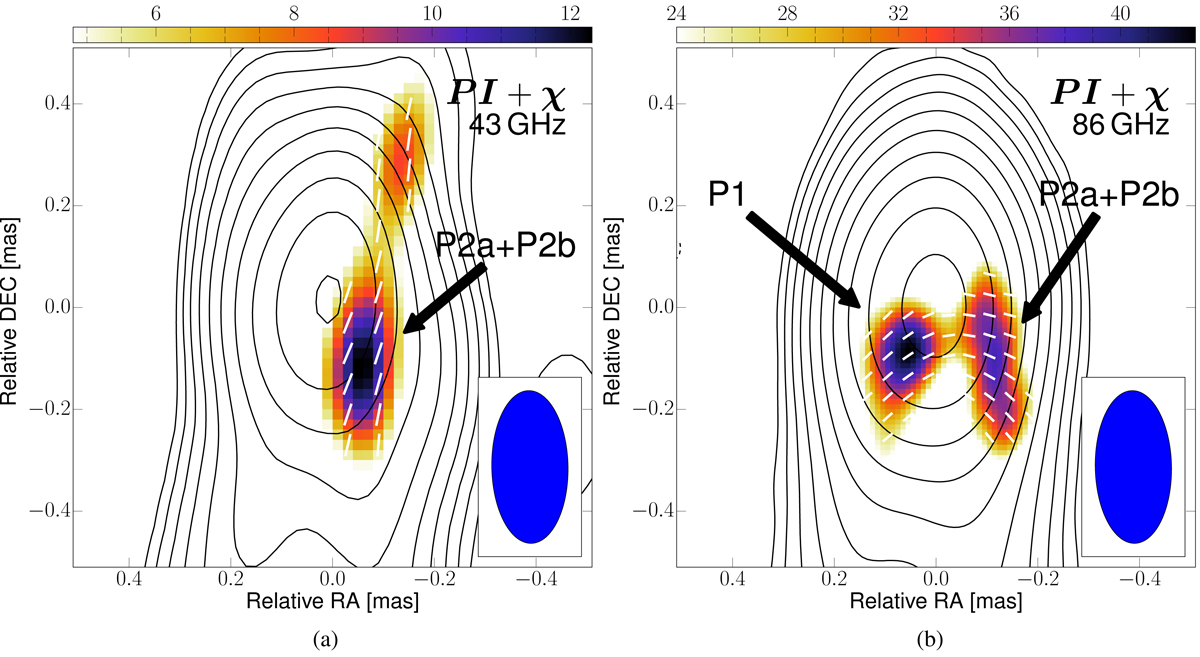
Comparison of the total intensity, the polarized intensity (PI) and the polarization angle ( χ) in the nuclear region at 43 and 86 GHz. The maps are restored with the same VLBA 43 GHz CLEAN beam and displayed over the same RA and Dec ranges (±0.5 mas). The arrows show the polarized component identifications. Panel a: as in the central panel of Fig. 2 (43 GHz) but zoomed into the core. Panel b: GMVA 86 GHz total and linear polarization image restored with the VLBA 43 GHz beam. The contours start at 6 mJy beam−1 and increase by a factor of two from the lowest level. The color scale starts from 24 mJy beam−1.
Current usage metrics show cumulative count of Article Views (full-text article views including HTML views, PDF and ePub downloads, according to the available data) and Abstracts Views on Vision4Press platform.
Data correspond to usage on the plateform after 2015. The current usage metrics is available 48-96 hours after online publication and is updated daily on week days.
Initial download of the metrics may take a while.