Fig. 5.
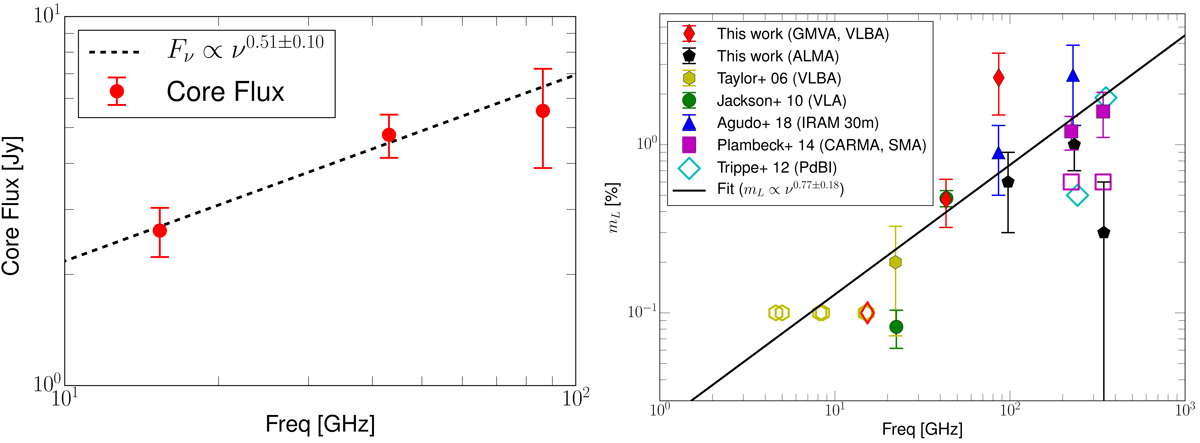
Left panel: total intensity spectrum of the VLBI core region between 15 and 86 GHz. Right panel: degree of linear polarization in the VLBI core region obtained from this work and previous VLBA observations (Taylor et al. 2006) and integrated values from the literature (Jackson et al. 2010; Trippe et al. 2012; Plambeck et al. 2014; Agudo et al. 2018b). All the VLBI polarization measurements were made from the pixel values near the peak of the Stokes I. Filled and open symbols of the same marker indicate measured values and upper limits, respectively. Citations and corresponding instruments are shown in the legend. We note that at 230 GHz only upper limits were observed before May 2011 (Trippe et al. 2012; Plambeck et al. 2014). After October 2011, Plambeck et al. (2014) report a significantly higher linear polarization degree.
Current usage metrics show cumulative count of Article Views (full-text article views including HTML views, PDF and ePub downloads, according to the available data) and Abstracts Views on Vision4Press platform.
Data correspond to usage on the plateform after 2015. The current usage metrics is available 48-96 hours after online publication and is updated daily on week days.
Initial download of the metrics may take a while.