Fig. C.1.
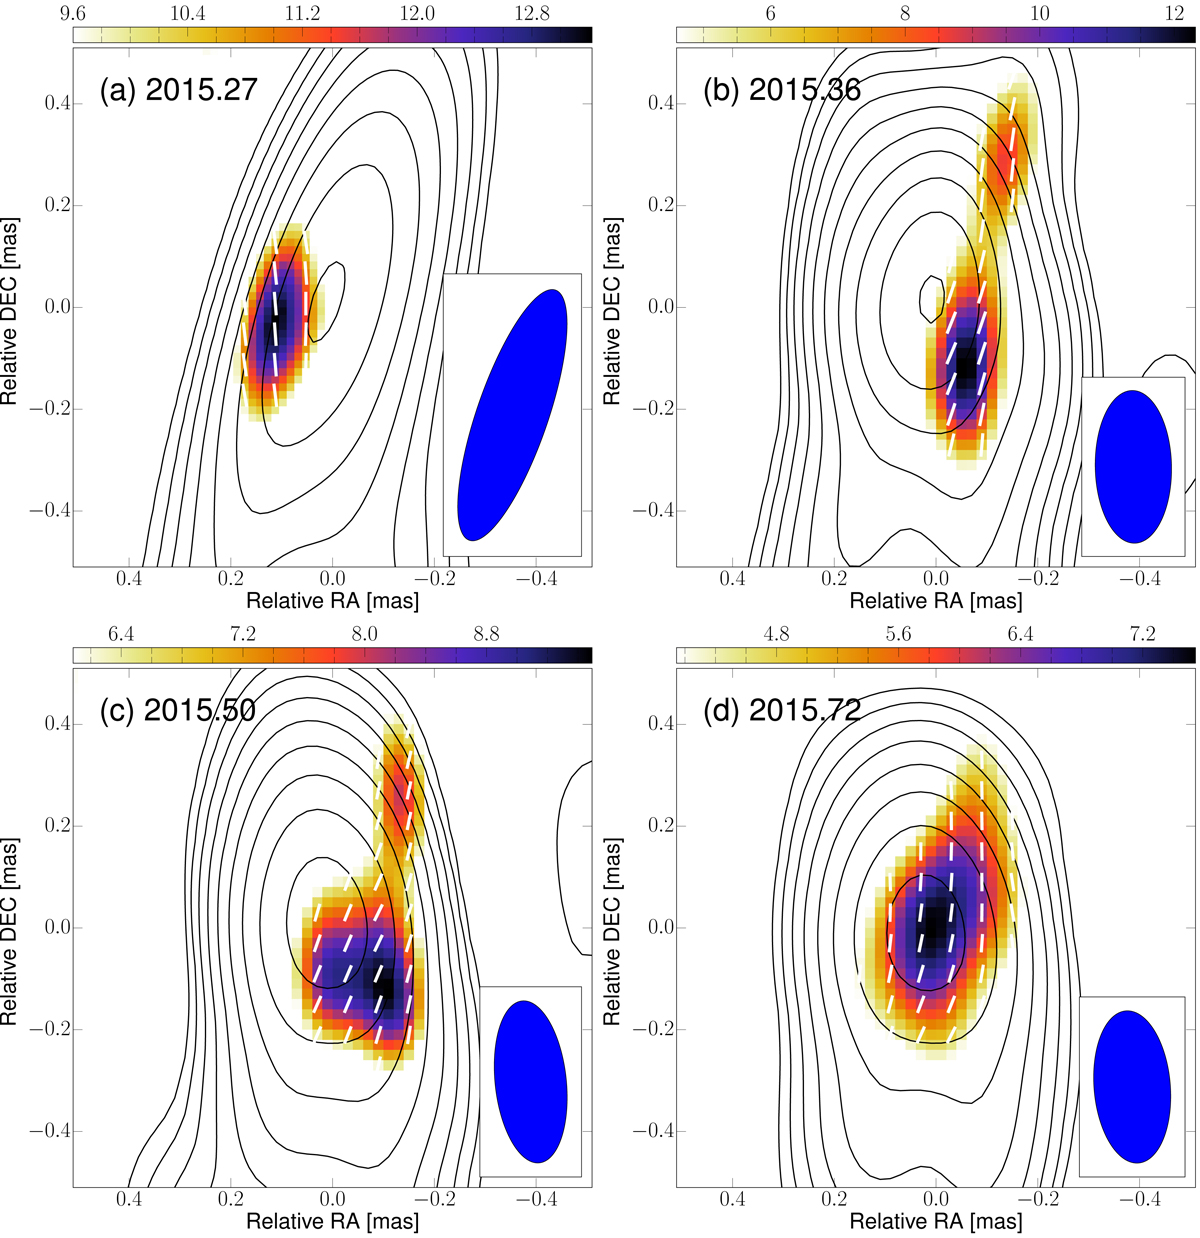
VLBA 43 GHz polarization images of 3C 84 zoomed into the core. Labels in the upper left of each panel denotes the observing epoch. The contours show the total intensity and start from 25, 7, 10 and 20 mJy beam−1 and increase by factor of two for the panels a, b, c and d, respectively. The color bar indicates the linear polarization intensity in mJy beam−1.
Current usage metrics show cumulative count of Article Views (full-text article views including HTML views, PDF and ePub downloads, according to the available data) and Abstracts Views on Vision4Press platform.
Data correspond to usage on the plateform after 2015. The current usage metrics is available 48-96 hours after online publication and is updated daily on week days.
Initial download of the metrics may take a while.