Free Access
Fig. A.1.
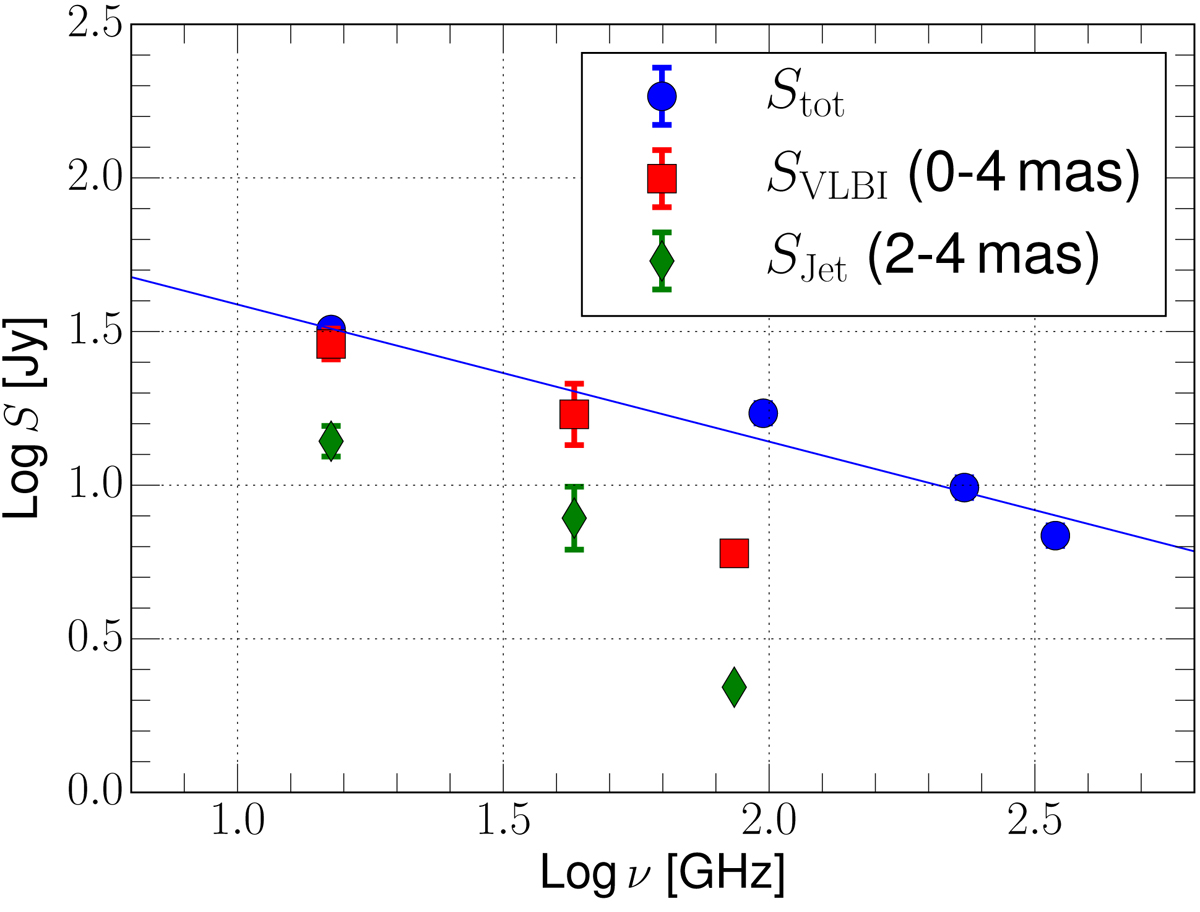
Quasi-simultaneous total and VLBI-scale flux densities of 3C 84 in May 2015 displayed in log–log scale. The blue solid line shows the power-law fitted to the total flux measurements. We omit the error bars for the GMVA 86 GHz data points.
Current usage metrics show cumulative count of Article Views (full-text article views including HTML views, PDF and ePub downloads, according to the available data) and Abstracts Views on Vision4Press platform.
Data correspond to usage on the plateform after 2015. The current usage metrics is available 48-96 hours after online publication and is updated daily on week days.
Initial download of the metrics may take a while.