Fig. 12.
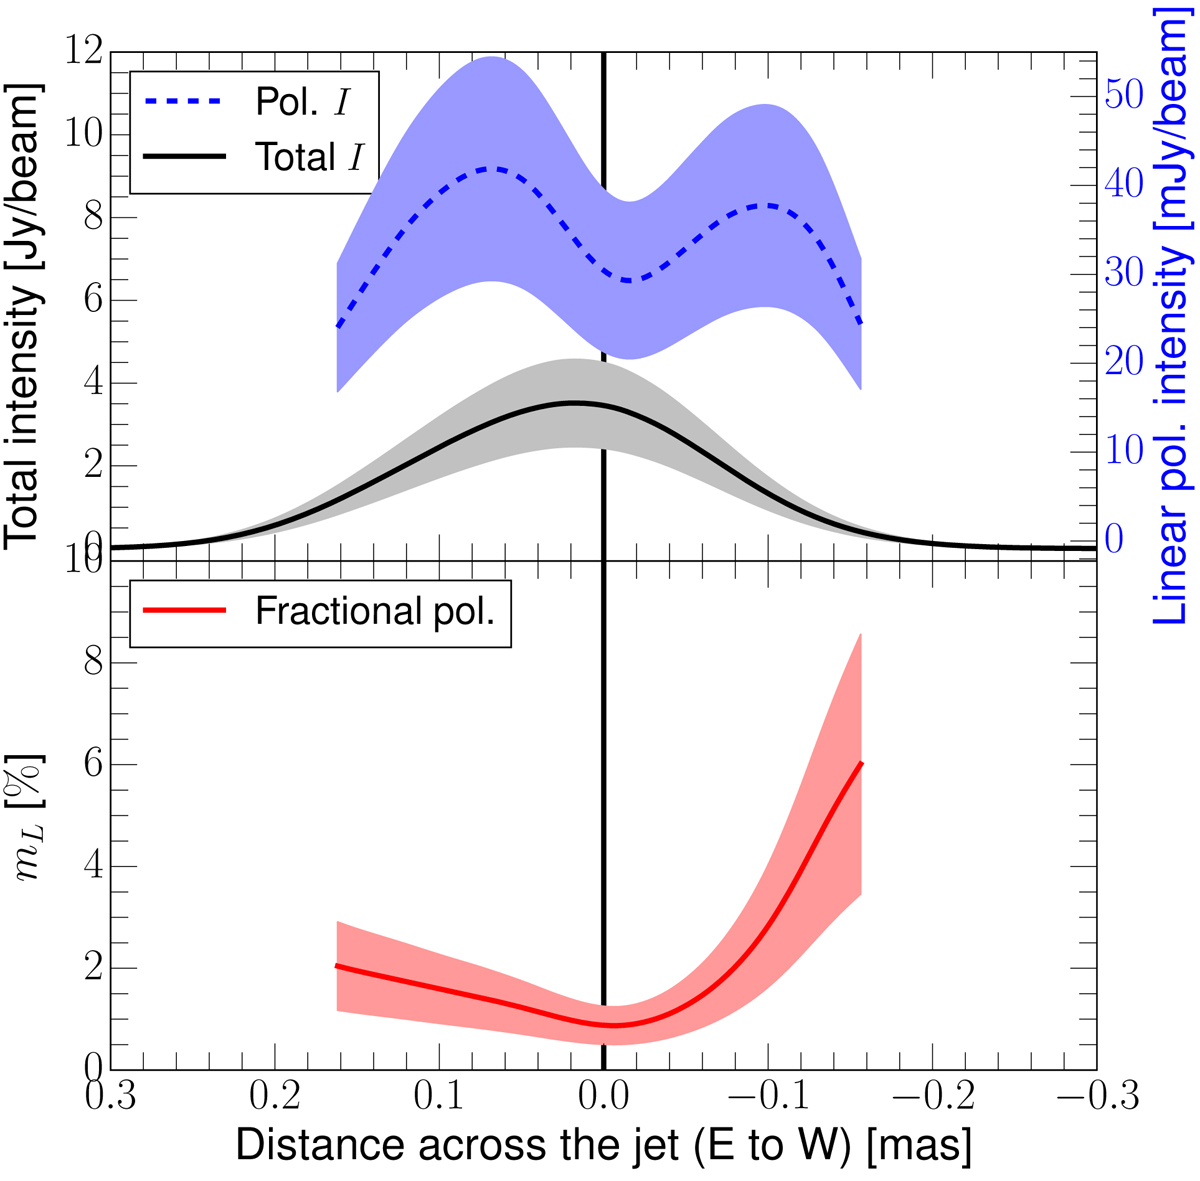
Top panel: total intensity, linear polarization intensity; bottom panel: degree of linear polarization at 86 GHz obtained by the slice transverse to the core and calculated by the pixel values in the image plane (negative core separation toward west; see Fig. 7). The solid black line indicates the position of the total intensity peak. The shaded area marks the measurement errors, assuming 30% uncertainty in the flux density measurements at 86 GHz (see Table 4). Only linear polarization higher than 24 mJy beam−1 is shown.
Current usage metrics show cumulative count of Article Views (full-text article views including HTML views, PDF and ePub downloads, according to the available data) and Abstracts Views on Vision4Press platform.
Data correspond to usage on the plateform after 2015. The current usage metrics is available 48-96 hours after online publication and is updated daily on week days.
Initial download of the metrics may take a while.