Free Access
Fig. 1.
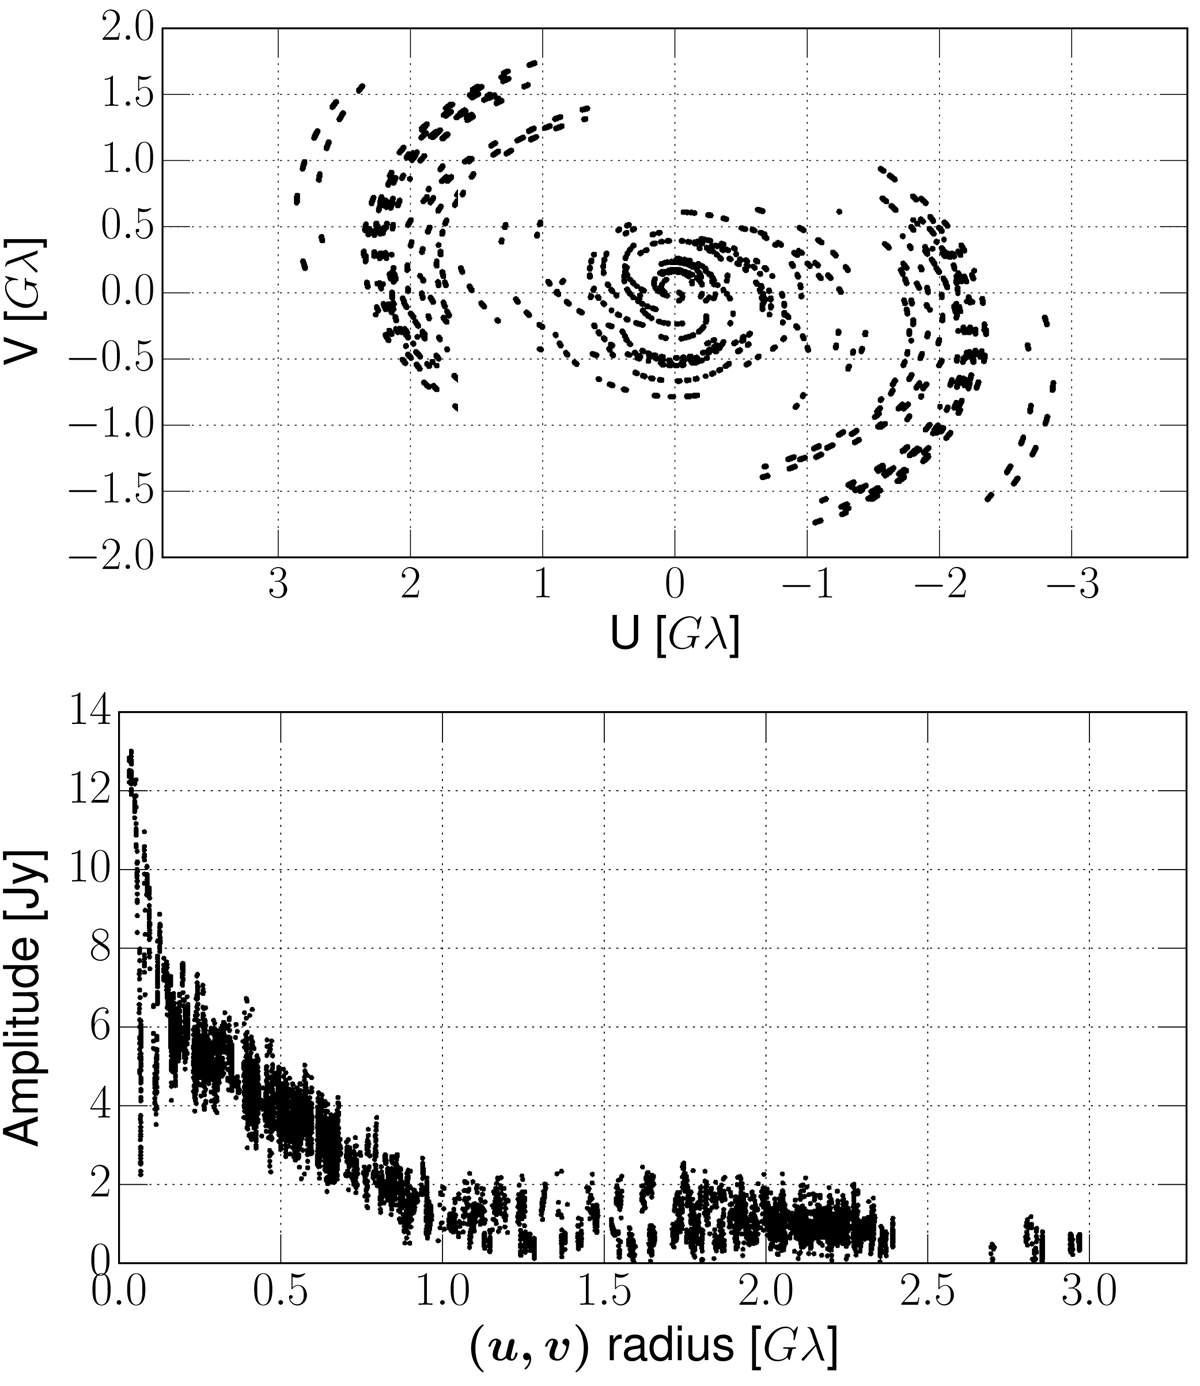
Stokes I visibilities of the GMVA data. Top panel: (u, v)-coverage after the a priori calibration and additional flagging for the imaging. Bottom panel: radial distribution of the visibility amplitudes after the last round of CLEAN and self-calibration. The visibility data were binned at 30 s for clarity.
Current usage metrics show cumulative count of Article Views (full-text article views including HTML views, PDF and ePub downloads, according to the available data) and Abstracts Views on Vision4Press platform.
Data correspond to usage on the plateform after 2015. The current usage metrics is available 48-96 hours after online publication and is updated daily on week days.
Initial download of the metrics may take a while.