Free Access
Fig. 6.
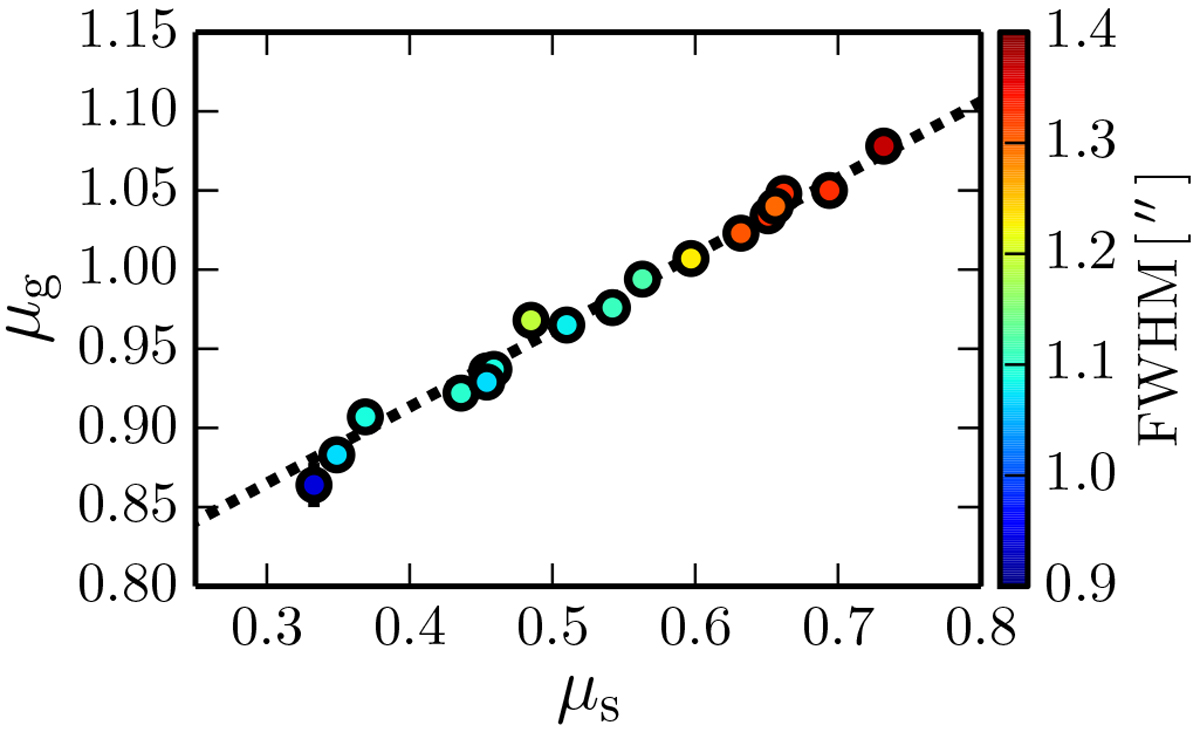
Position of the galaxy locus, μg, as a function of the position of the stellar locus, μs. The colour scale shows the PSF FWHM of the r-band images. Thedotted line is the error-weighted linear fit to the points.
Current usage metrics show cumulative count of Article Views (full-text article views including HTML views, PDF and ePub downloads, according to the available data) and Abstracts Views on Vision4Press platform.
Data correspond to usage on the plateform after 2015. The current usage metrics is available 48-96 hours after online publication and is updated daily on week days.
Initial download of the metrics may take a while.