Fig. 4.
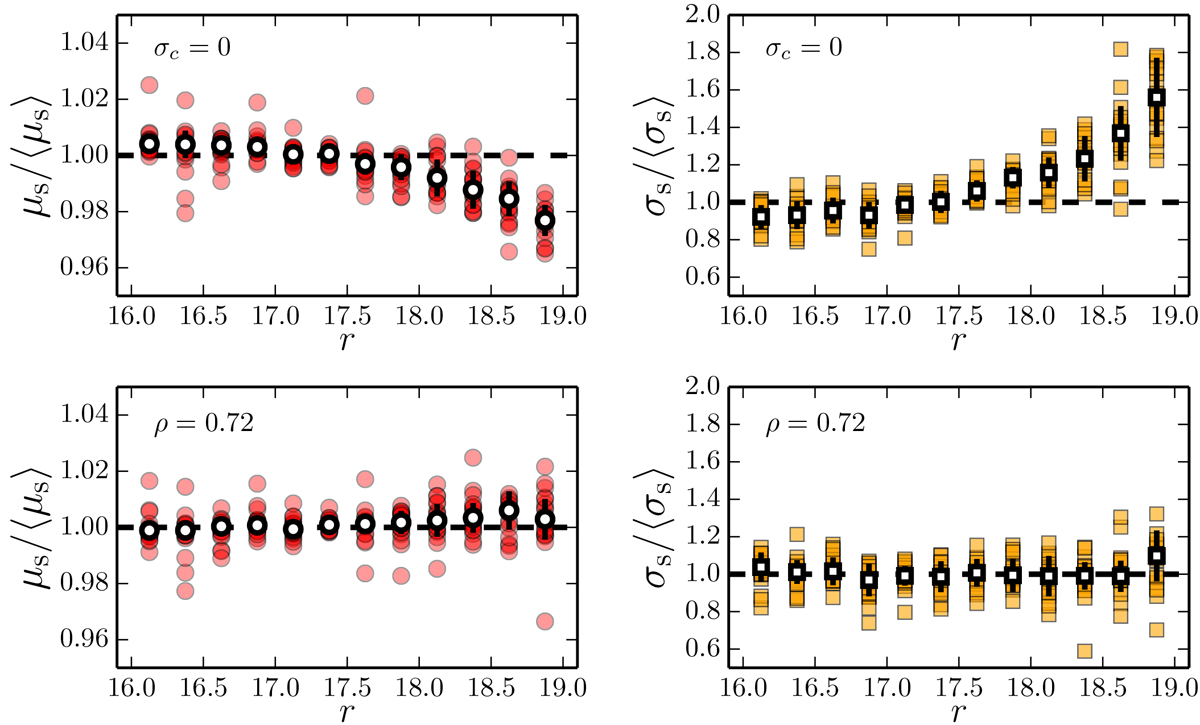
Variation in the normalised stellar locus position (circles in the left panels) and dispersion (squares in the right panels) with r-band magnitude. The coloured symbols mark the measurements in each J-PLUS EDR pointing. The white symbols show the median and the dispersion of the pointing-based values. The dashed lines mark identity. The top panels show the results assuming no concentration uncertainties (σc = 0), and the bottom panels with the uncertainties, computed assuming a covariance ρ = 0.72, properly accounted for.
Current usage metrics show cumulative count of Article Views (full-text article views including HTML views, PDF and ePub downloads, according to the available data) and Abstracts Views on Vision4Press platform.
Data correspond to usage on the plateform after 2015. The current usage metrics is available 48-96 hours after online publication and is updated daily on week days.
Initial download of the metrics may take a while.