Fig. 11.
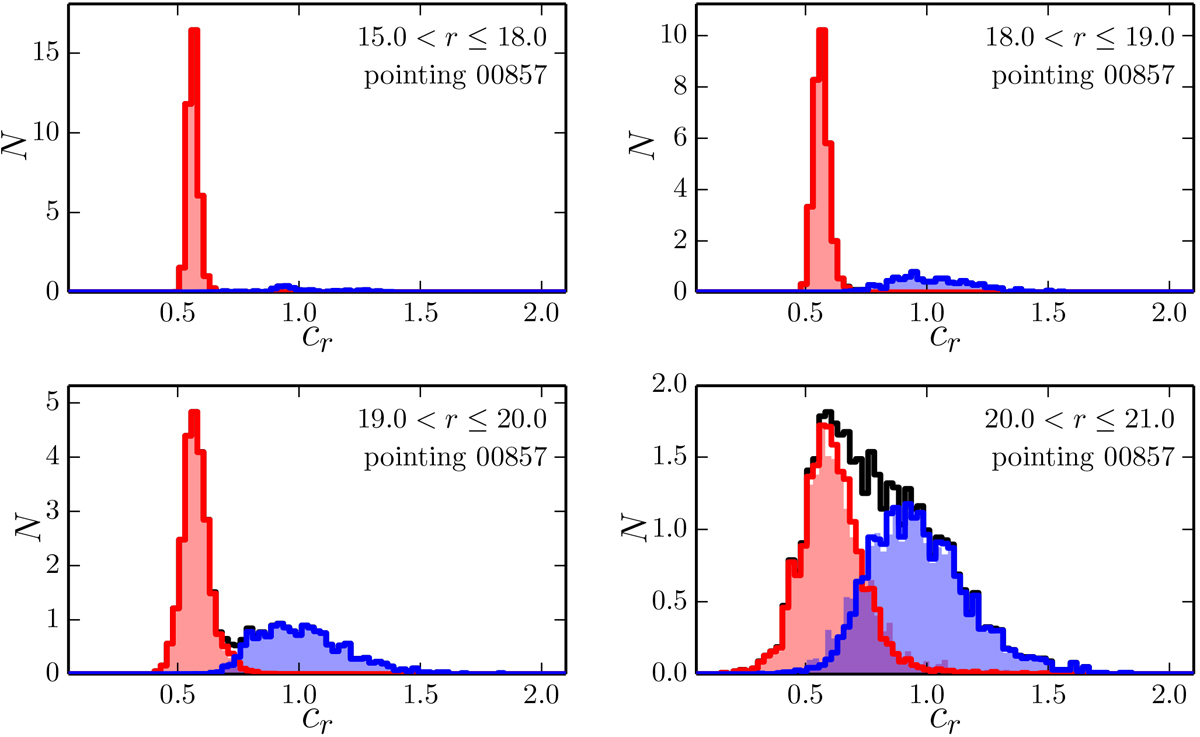
Distribution of stars (red) and galaxies (blue) in the r-band concentration space for different magnitude ranges (labelled in the panels) in the J-PLUS EDR pointing 00857. The coloured solid lines mark the PDF-weighted histograms estimated with our probabilistic PDF-based classifier. The coloured areas show the histograms estimated with the SDSS classification of J-PLUS sources. The black solid histogram is the total distribution, illustrating the confusion between compact and extended sources at the faintest magnitudes.
Current usage metrics show cumulative count of Article Views (full-text article views including HTML views, PDF and ePub downloads, according to the available data) and Abstracts Views on Vision4Press platform.
Data correspond to usage on the plateform after 2015. The current usage metrics is available 48-96 hours after online publication and is updated daily on week days.
Initial download of the metrics may take a while.