Fig. 10.
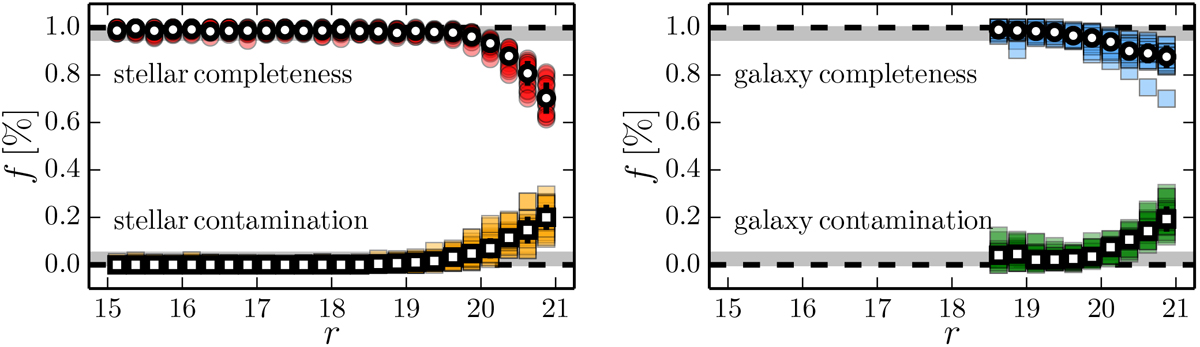
Completeness (circles) and contamination (squares) of the J-PLUS EDR stars (left panel) and galaxies (right panel) as a function of the r-band magnitude. Sources were classified using PDFgri = 0.5 as boundary. The coloured symbols show the estimation on individual J-PLUS EDR pointings. The white symbols are the median values of the pointings. The grey areas mark the 95% completeness and 5% contamination tolerance regions used to define the performance of our classifier.
Current usage metrics show cumulative count of Article Views (full-text article views including HTML views, PDF and ePub downloads, according to the available data) and Abstracts Views on Vision4Press platform.
Data correspond to usage on the plateform after 2015. The current usage metrics is available 48-96 hours after online publication and is updated daily on week days.
Initial download of the metrics may take a while.