Fig. 1.
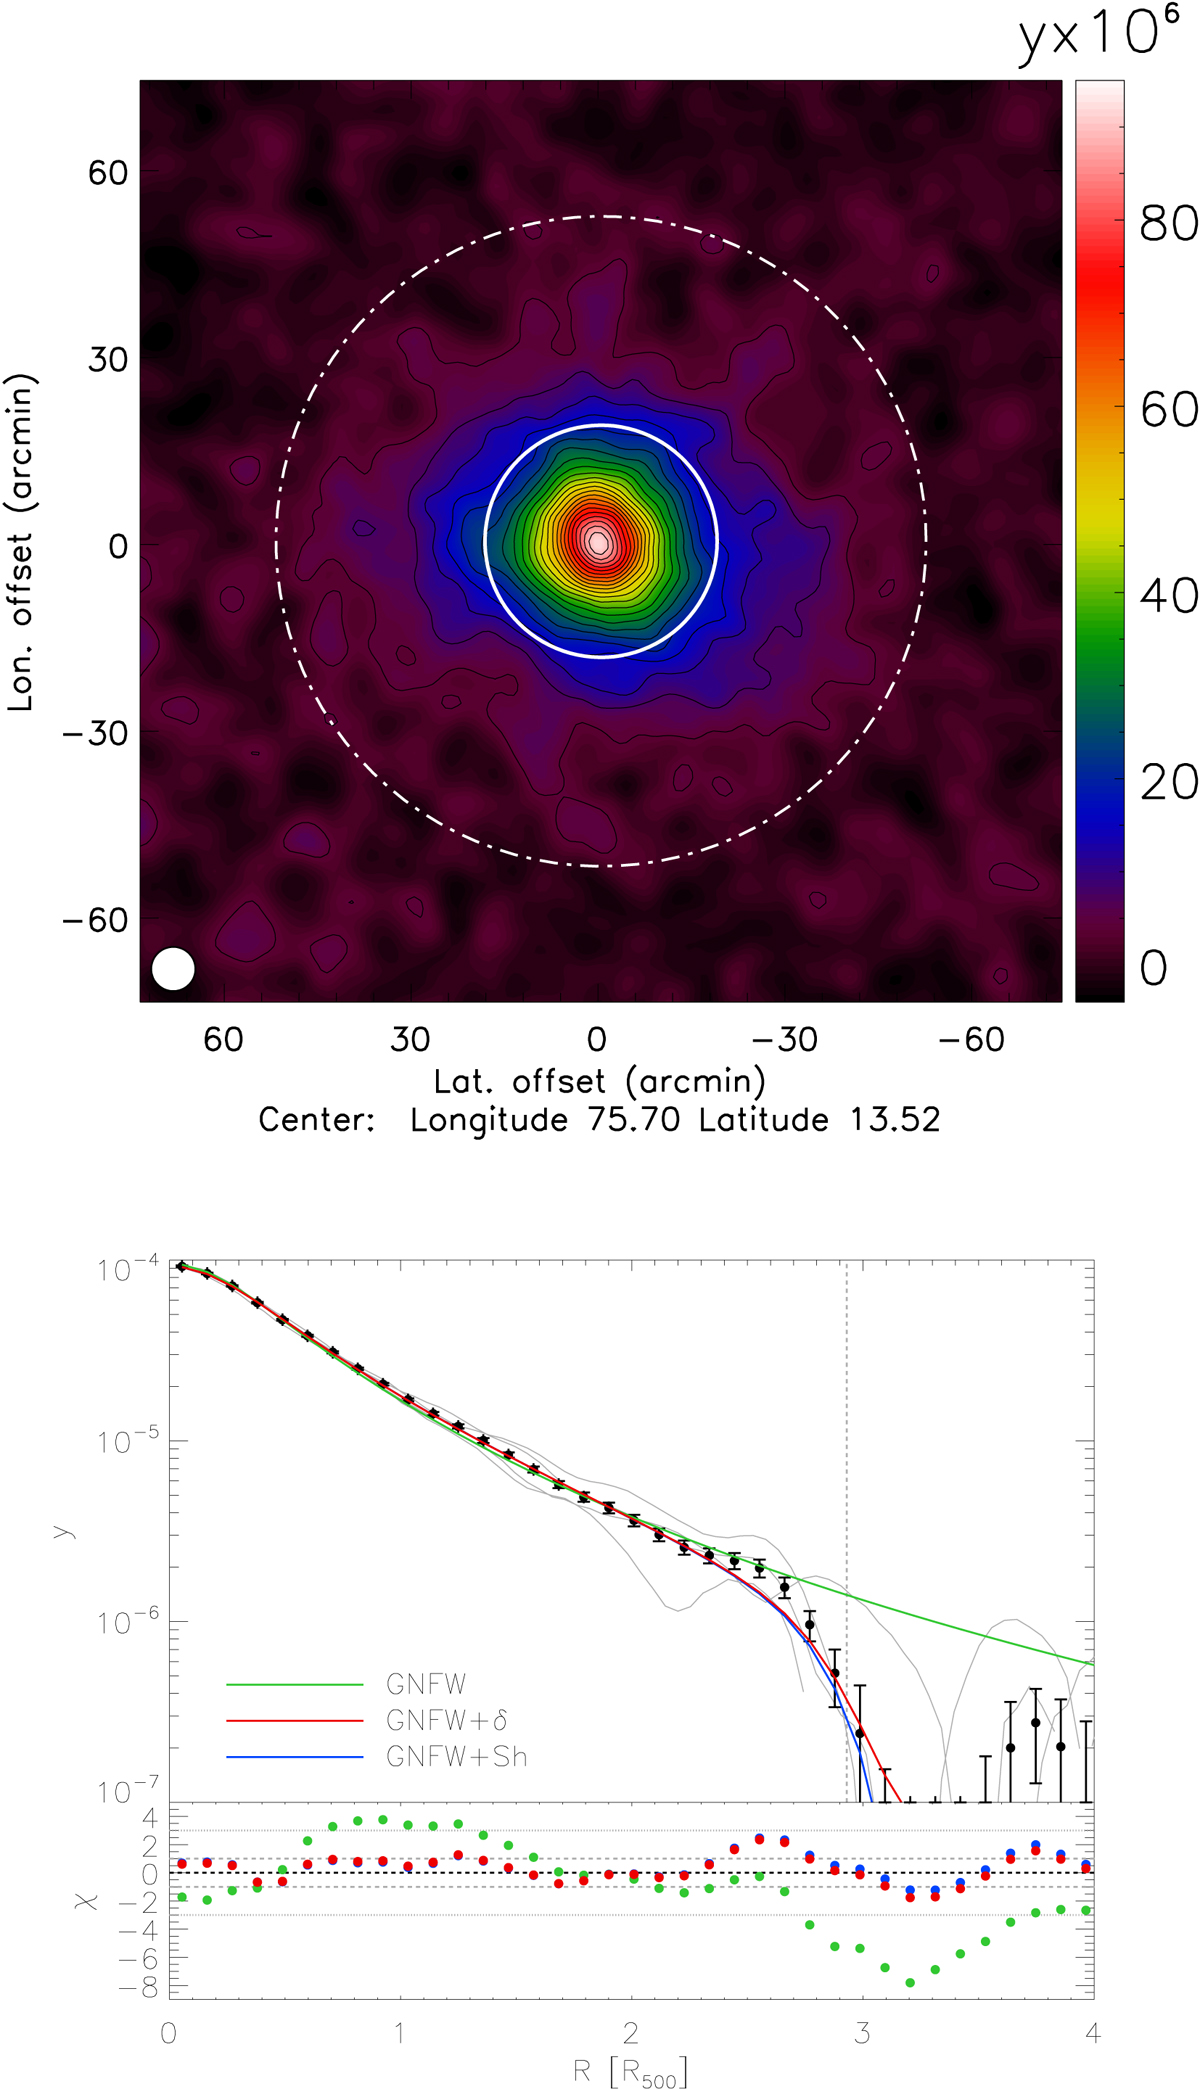
Top panel: MILCA tSZ map of A2319. The solid and dashed white circles show the typical radius of the cluster, R500, and the shock radius, RSh, detected in the azimuthal profile. The beam FWHM is given by the white circle in the bottom left corner, and the black contours provide the S/N in units of 2σ. The gray thin lines present the profiles for each quadrant of A2319. Bottom panel: tSZ azimuthal profile of A2319. The black samples show the measured tSZ signal in the MILCA map, while the green, red, and blue solid lines plot the GNFW, GNFW+δ (extra outer slope), and GNFW+Sh (shock) best-fit models, respectively. The vertical dashed gray line corresponds to Rsh = (2.93 ± 0.05) R500. The residual, normalized by the error bars, χ, is also shown for all the models.
Current usage metrics show cumulative count of Article Views (full-text article views including HTML views, PDF and ePub downloads, according to the available data) and Abstracts Views on Vision4Press platform.
Data correspond to usage on the plateform after 2015. The current usage metrics is available 48-96 hours after online publication and is updated daily on week days.
Initial download of the metrics may take a while.