Fig. 8.
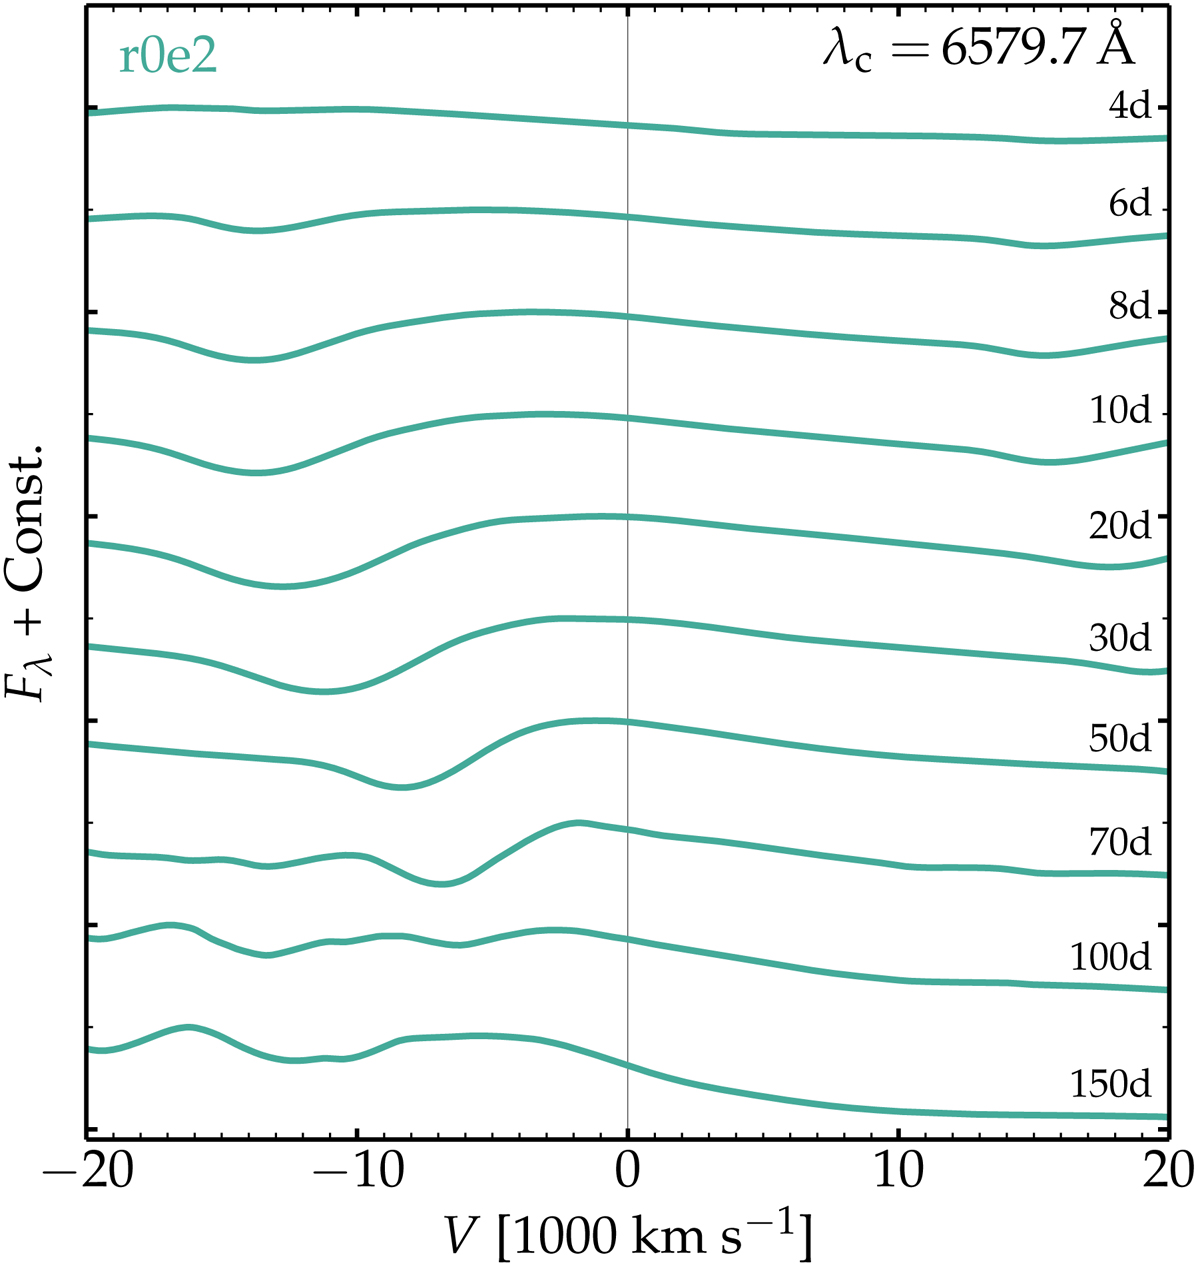
Evolution of the spectral region around λc = 6579.7 Å for model r0e2 to illustrate the evolution of the Doppler velocity at maximum absorption as well as the peak blueshift. The value of λc corresponds to the air wavelength of the gf-weighted mean of the corresponding C II doublet. The Doppler velocity at the location of maximum absorption in this line follows closely the velocity of the photosphere shown in Fig. 6.
Current usage metrics show cumulative count of Article Views (full-text article views including HTML views, PDF and ePub downloads, according to the available data) and Abstracts Views on Vision4Press platform.
Data correspond to usage on the plateform after 2015. The current usage metrics is available 48-96 hours after online publication and is updated daily on week days.
Initial download of the metrics may take a while.